Excel처럼 plot 영역의 밖에 legend를 출력할 수 없냐는 혹자의 질문이 있었다. 한번도 생각해보지 않은 주제라 막연히 mtext(), ploygon() 등의 함수로 사용자 정의 함수를 만들어 구현할 수 있을 것 같았다. 그런데, R graphics parameter를 이용하면 쉽게 해결할 수 있다.
R Graphics Device의 이해
우선 R Graphics Device에 플롯을 출력하는 영역의 구분에 대해서 알아보자.
플롯을 그리는 영역에는 figure region과 figure margin이 있다. figure region은 플롯을 표현하는 영역으로 실제로 플롯이 위치하는 plot region을 포함한다. figure margin은 figure region 안에서의 plot region의 여백이다. 그리고 figure region 밖의 여백을 outer margin이라 한다.
R Graphics Device의 구조는 다음 그림을 통해 쉽게 이해할 수 있다.
par(oma = c(2, 2, 2, 2))
set.seed(1)
x <- rnorm(100)
hist(x, col = "lightblue")

box(which = "plot"  , lty = 1, cex = 1.5, col = "red")
box(which = "figure", lty = 2, cex = 1.5, col = "blue")
#box(which = "inner" , lty = 3, cex = 1.5)
box(which = "outer" , lty = 4, cex = 1.5, col = "black")

text(-2, 15, "plot region")

mtext("figure region", side = 3, adj = 0, at = -3, line = 2)
mtext("margin 1", side = 1, col = "red")
mtext("margin 2", side = 2, col = "red")
mtext("margin 3", side = 3, col = "red")
mtext("margin 4", side = 4, col = "red")

mtext("outer margin area", side = 3, adj = 0, line = 1, outer = TRUE)
mtext("outer margin 1", side = 1, outer = TRUE, col = "blue")
mtext("outer margin 2", side = 2, outer = TRUE, col = "blue")
mtext("outer margin 3", side = 3, outer = TRUE, col = "blue")
mtext("outer margin 4", side = 4, outer = TRUE, col = "blue")
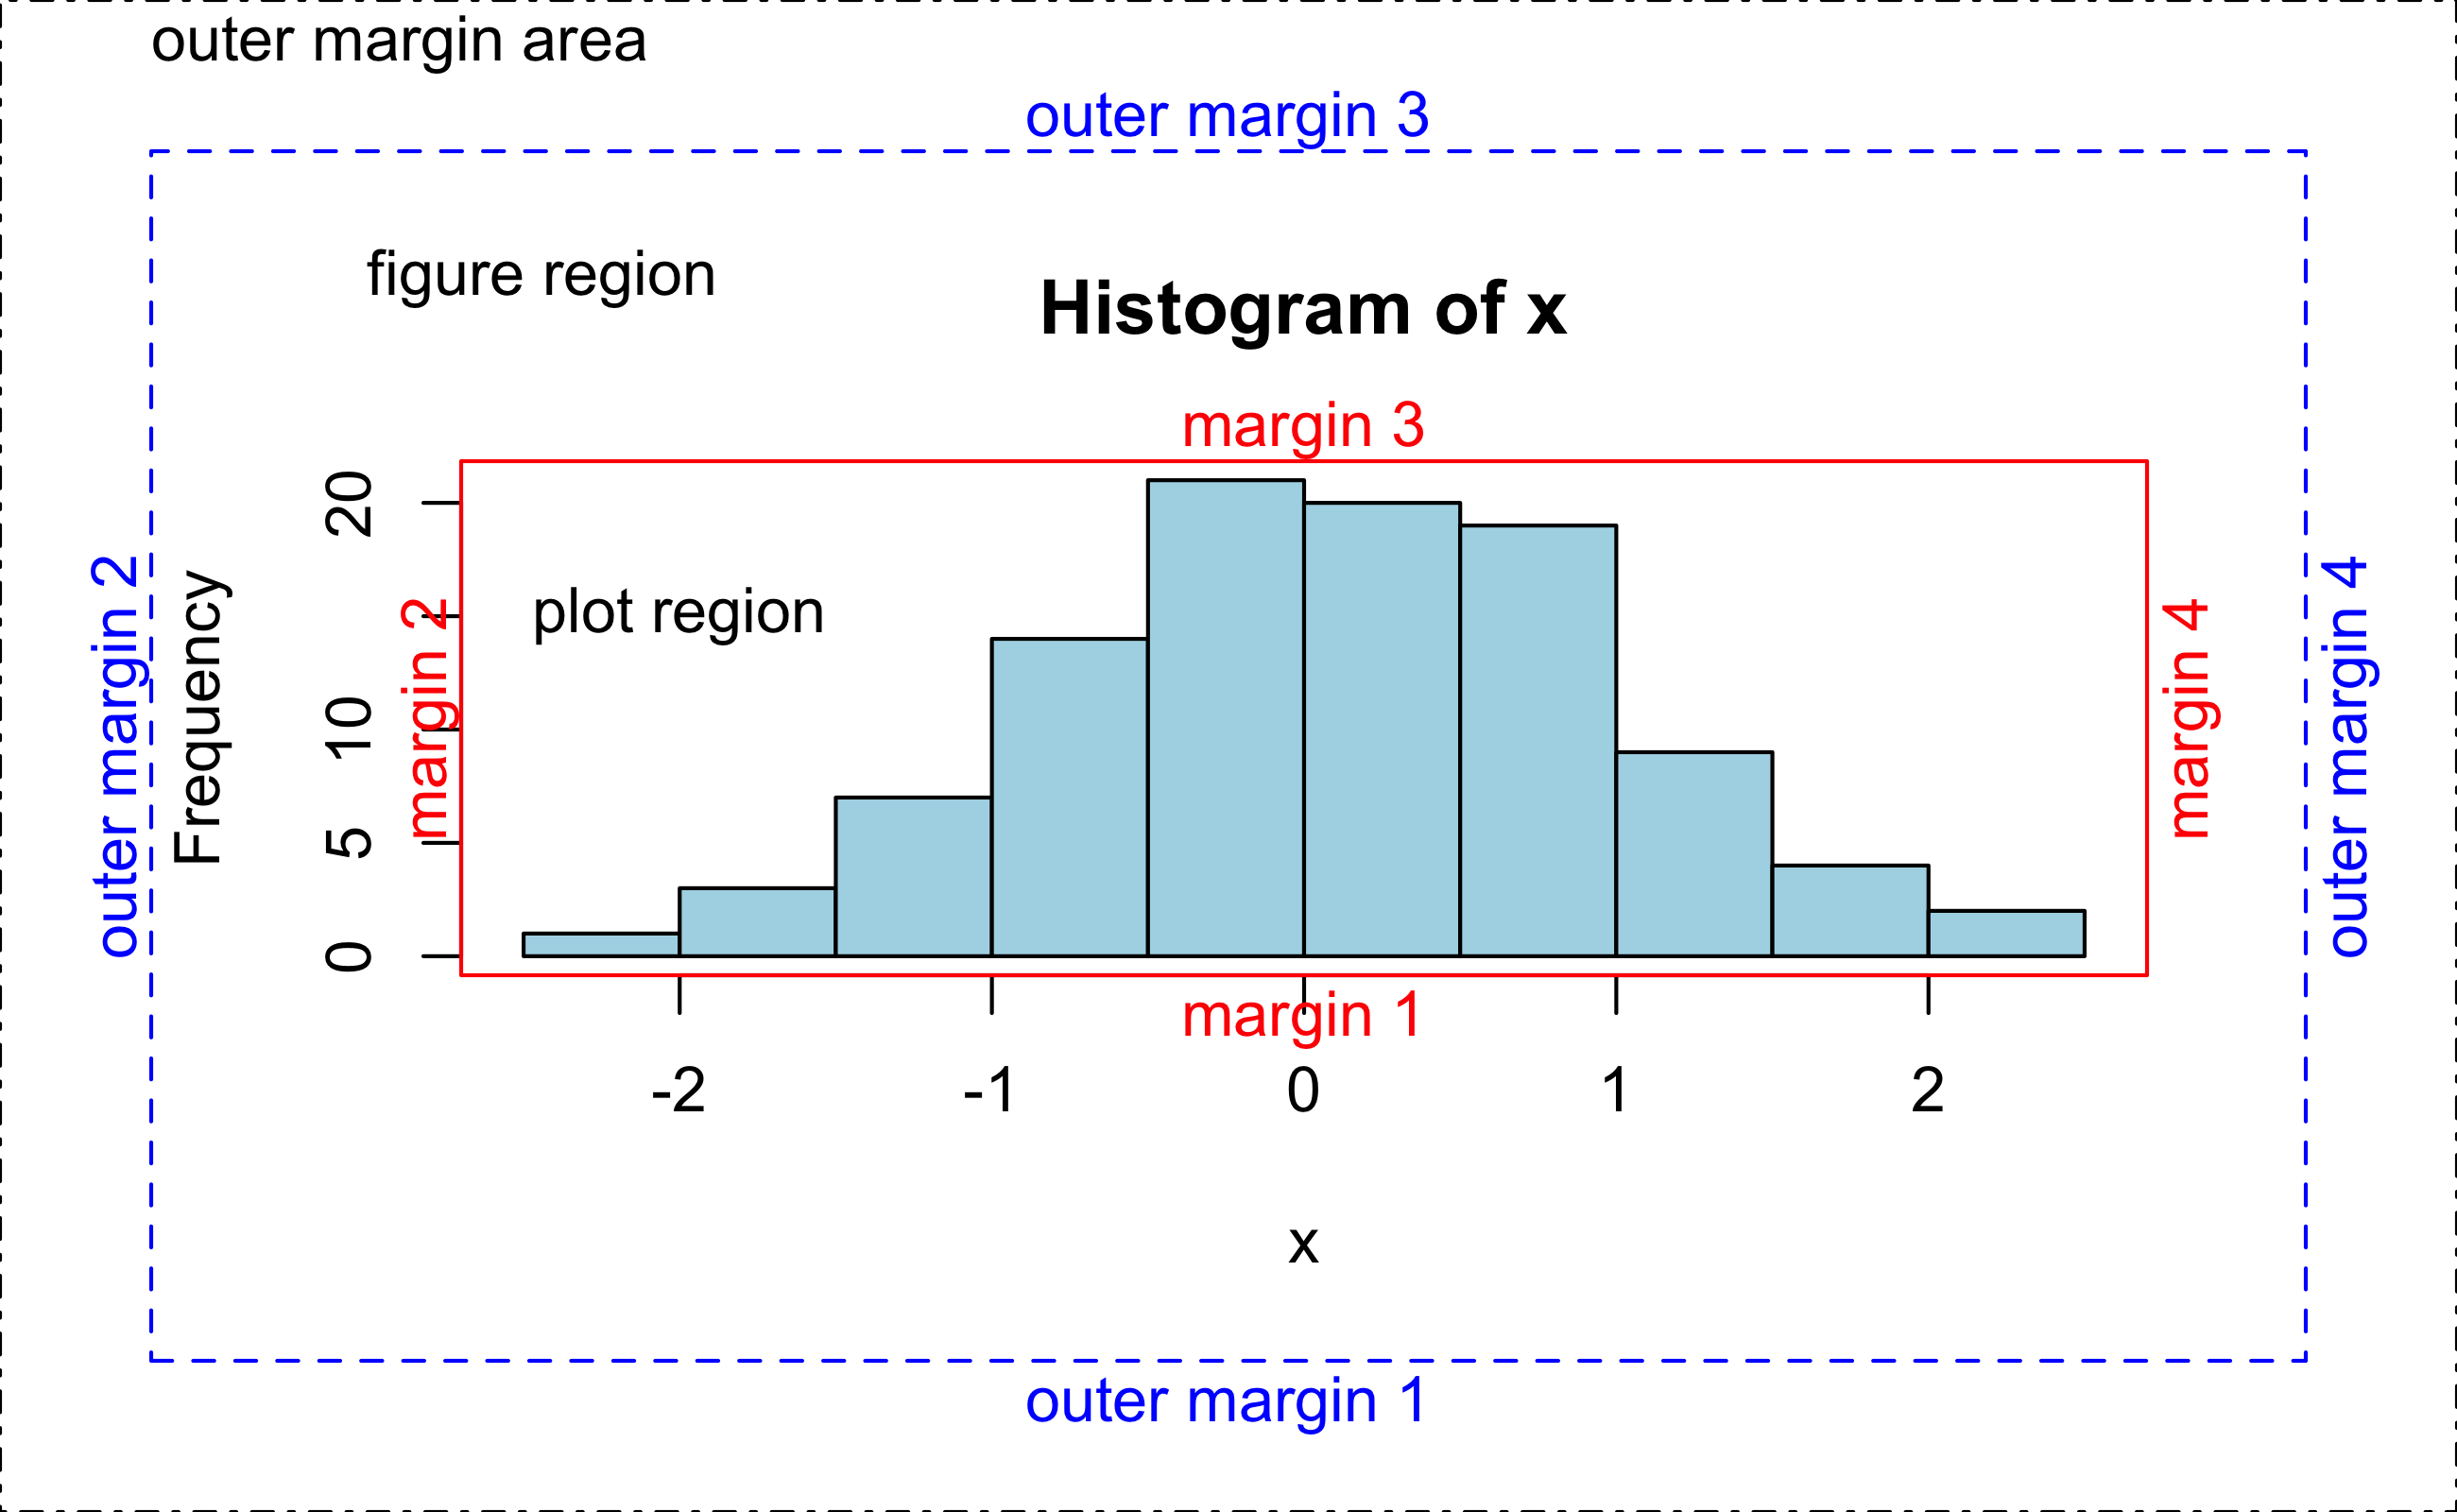
Figure 1: R Graphics Device의 구조
legend 표현하기
일반적인 legend 사용법은 다음과 같으며, legend는 plot region 안에 위치하게 된다. 그러나 plot region이 legend를 표시한 공간이 없이 빼곡하게 플롯으로 채워진다면 legend를 표시할 수 없게 된다. 이 경우는 plot region 밖에 legend를 출력하고 싶어질 것이다.
n.row <- 10
n.col <- 3

mat <- matrix(0, nrow = n.row, ncol = n.col)

set.seed(123)
for (i in 1:n.col)
  mat[, i] <- sample(1:(n.row * n.col),
                     size = n.row, replace = TRUE)

matplot(mat, type="n", ylim = c(0, 40))
matpoints(mat, type="p", pch = 1:3)
matlines(mat)

title("Inside plot region example")
legend("topright", legend = paste("Sample", 1:n.col),
       col = 1:n.col, pch = 1:n.col, lty = 1:n.col)
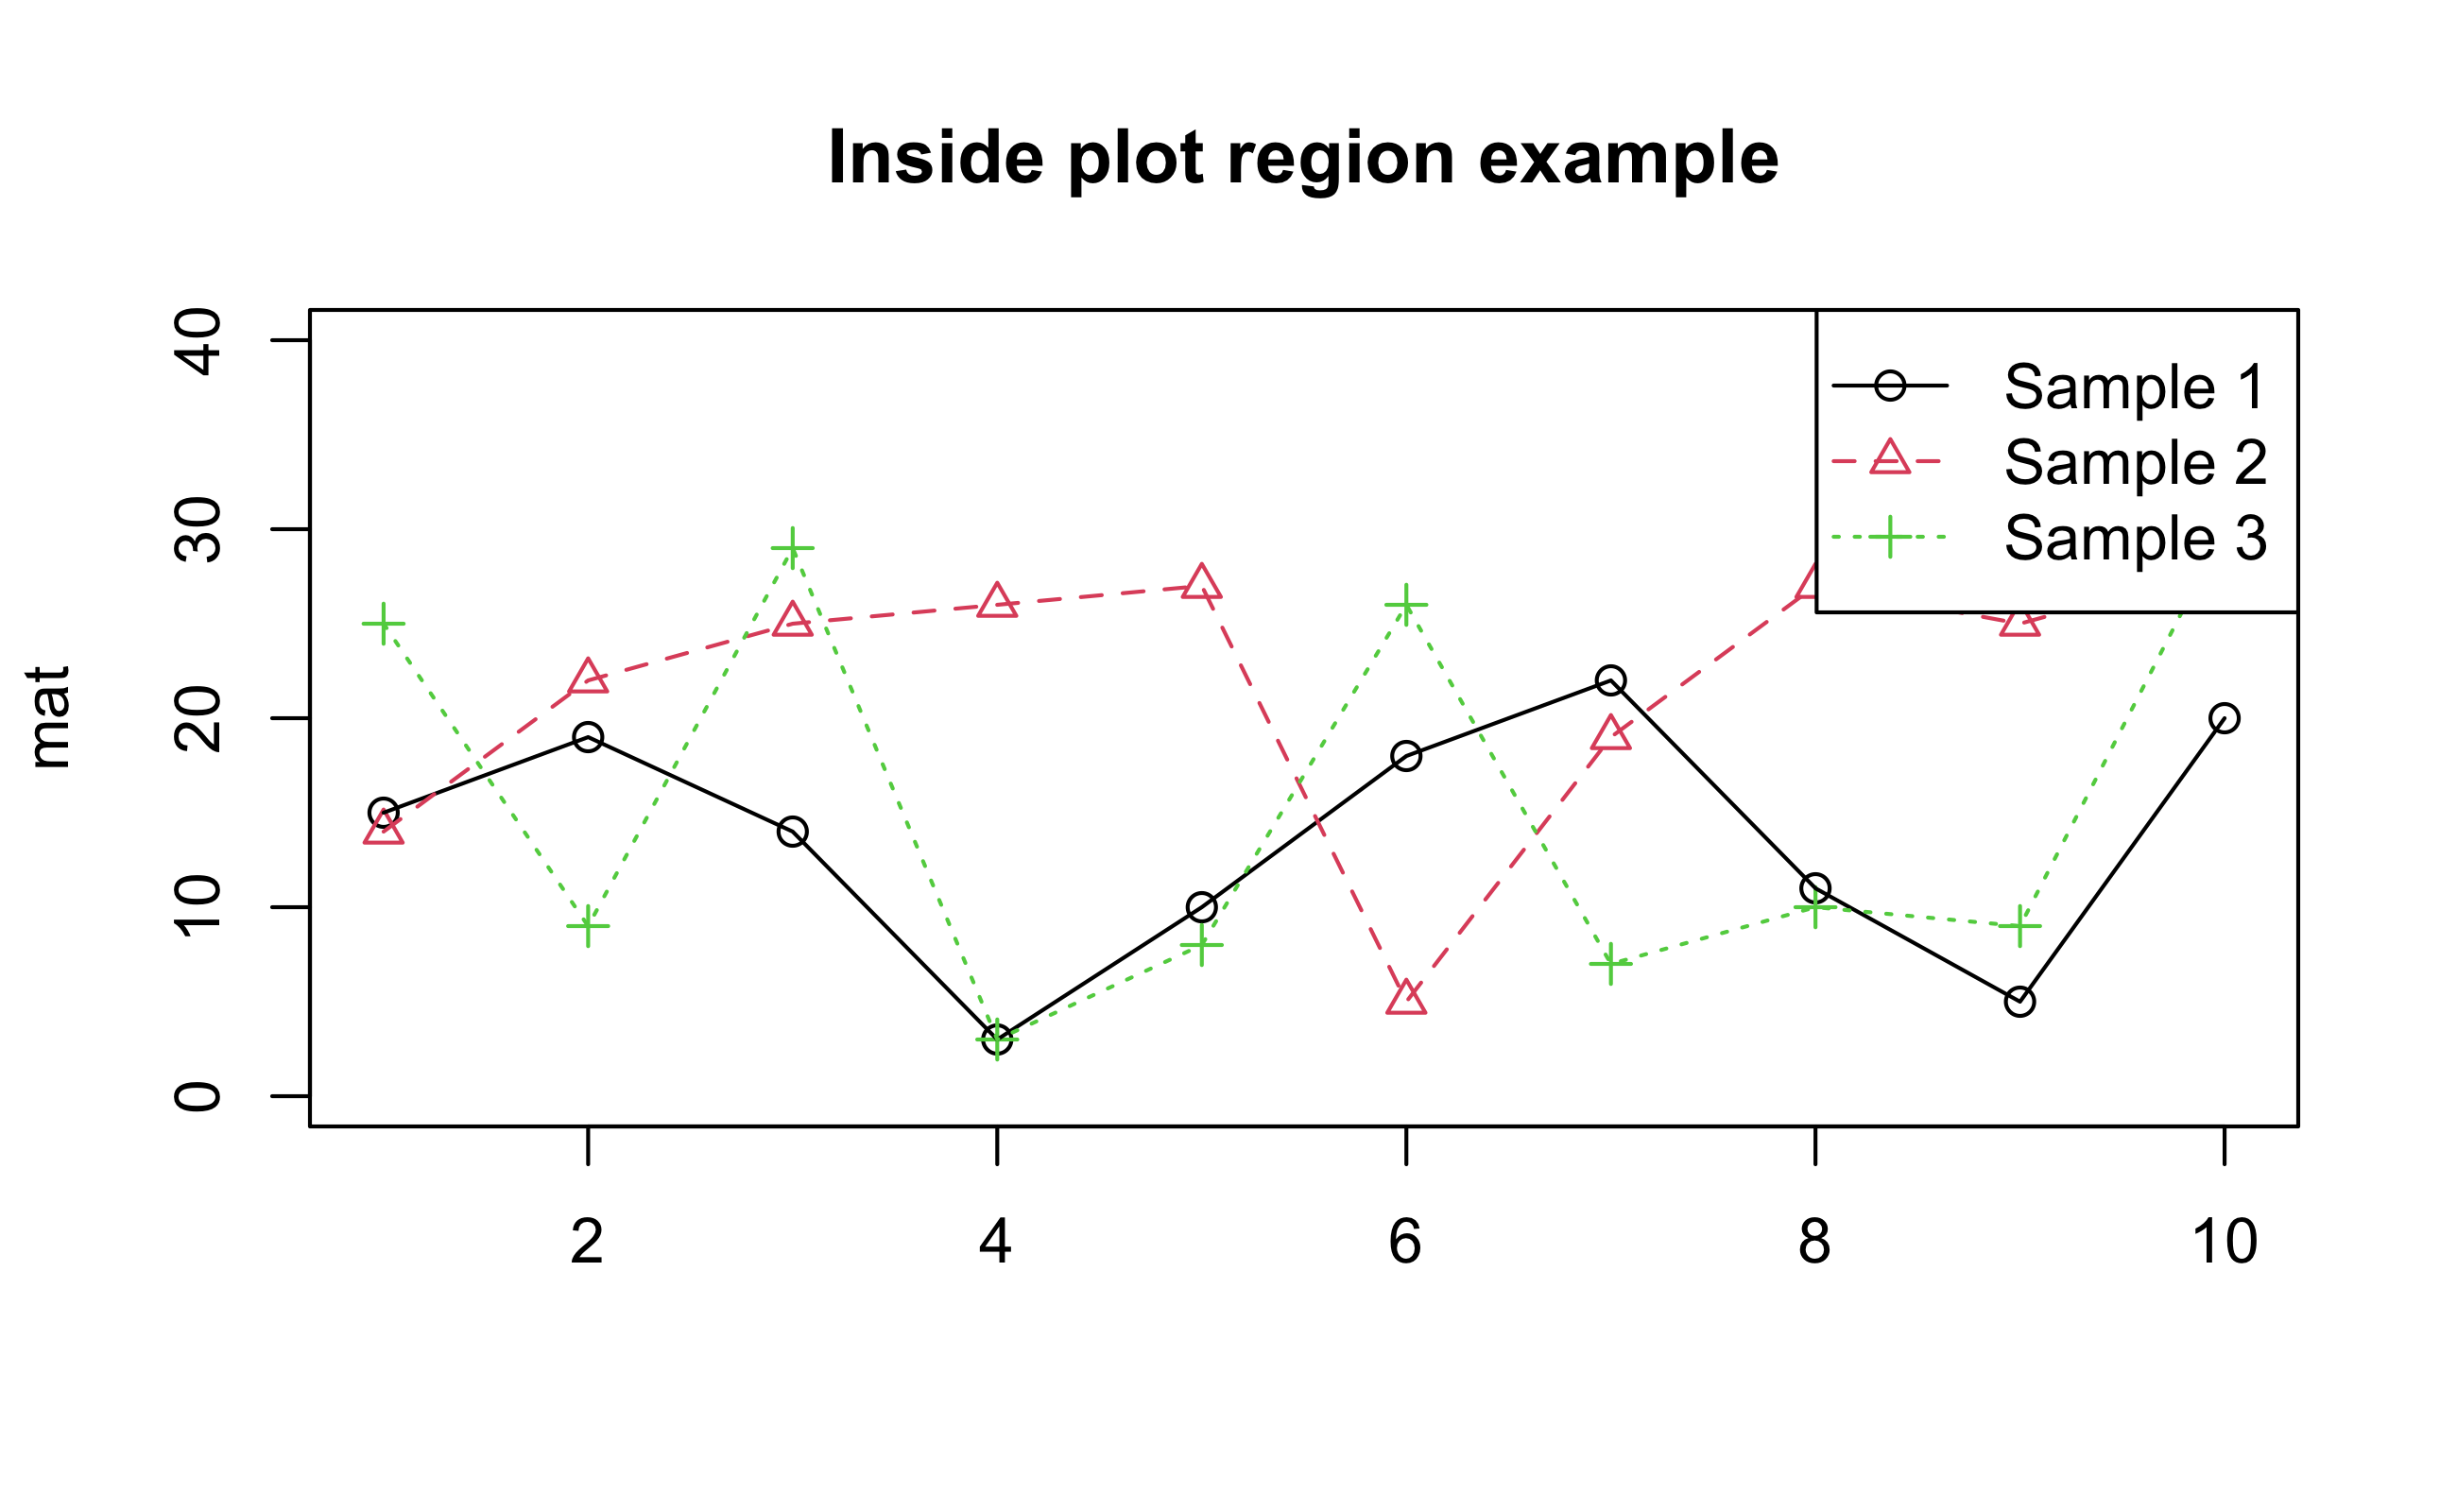
Figure 2: legend의 일반적인 사용 사례
plot 영역 밖에 legend 출력하기
par() 함수를 이용해서 R Graphics Device를 두 개의 영역으로 적당히 나눈 후 하나의 figure region에는 플롯을, 나머지 figure region에는 legend를 표시하면 plot region 밖에 legend를 출력할 수 있다.
plot region 밖에 legend를 출력하는 로직과 예제는 다음과 같다.
par()함수의 fig 인수를 이용해서 플롯을 출력할 figure region을 적당히 두 개로 분할한다.- 첫번 째 figure region의 plot region에 플롯을 출력한다.
par()함수의 new 인수로 신규 플롯을 현재의 graphic device에 출력하도록 설정한다.par()함수의 fig 인수로 남은 figure region을 legend를 출력할 figure region으로 설정한다.- 두번 째 figure region의 plot region에 빈 플롯을 그린 후, 그 위에 legend를 출력한다.
par(fig = c(0, 1, 0.2, 1), mar = c(2, 4, 4, 4))
matplot(mat, type="n")
matpoints(mat, type="p", pch=1:n.col)
matlines(mat)
title("Outside plot region example")

par(new = TRUE)
par(fig = c(0, 1, 0, 0.2), mar = c(0, 0, 0, 0))
plot(0, xlim = c(0, 1), ylim = c(0, 5),
     axes = FALSE, xlab = "", ylab = "", type = "n")
legend(0.2, 3.5, legend = paste("Sample", 1:n.col),
       col = 1:n.col, pch = 1:n.col, lty = 1:n.col, horiz = TRUE)
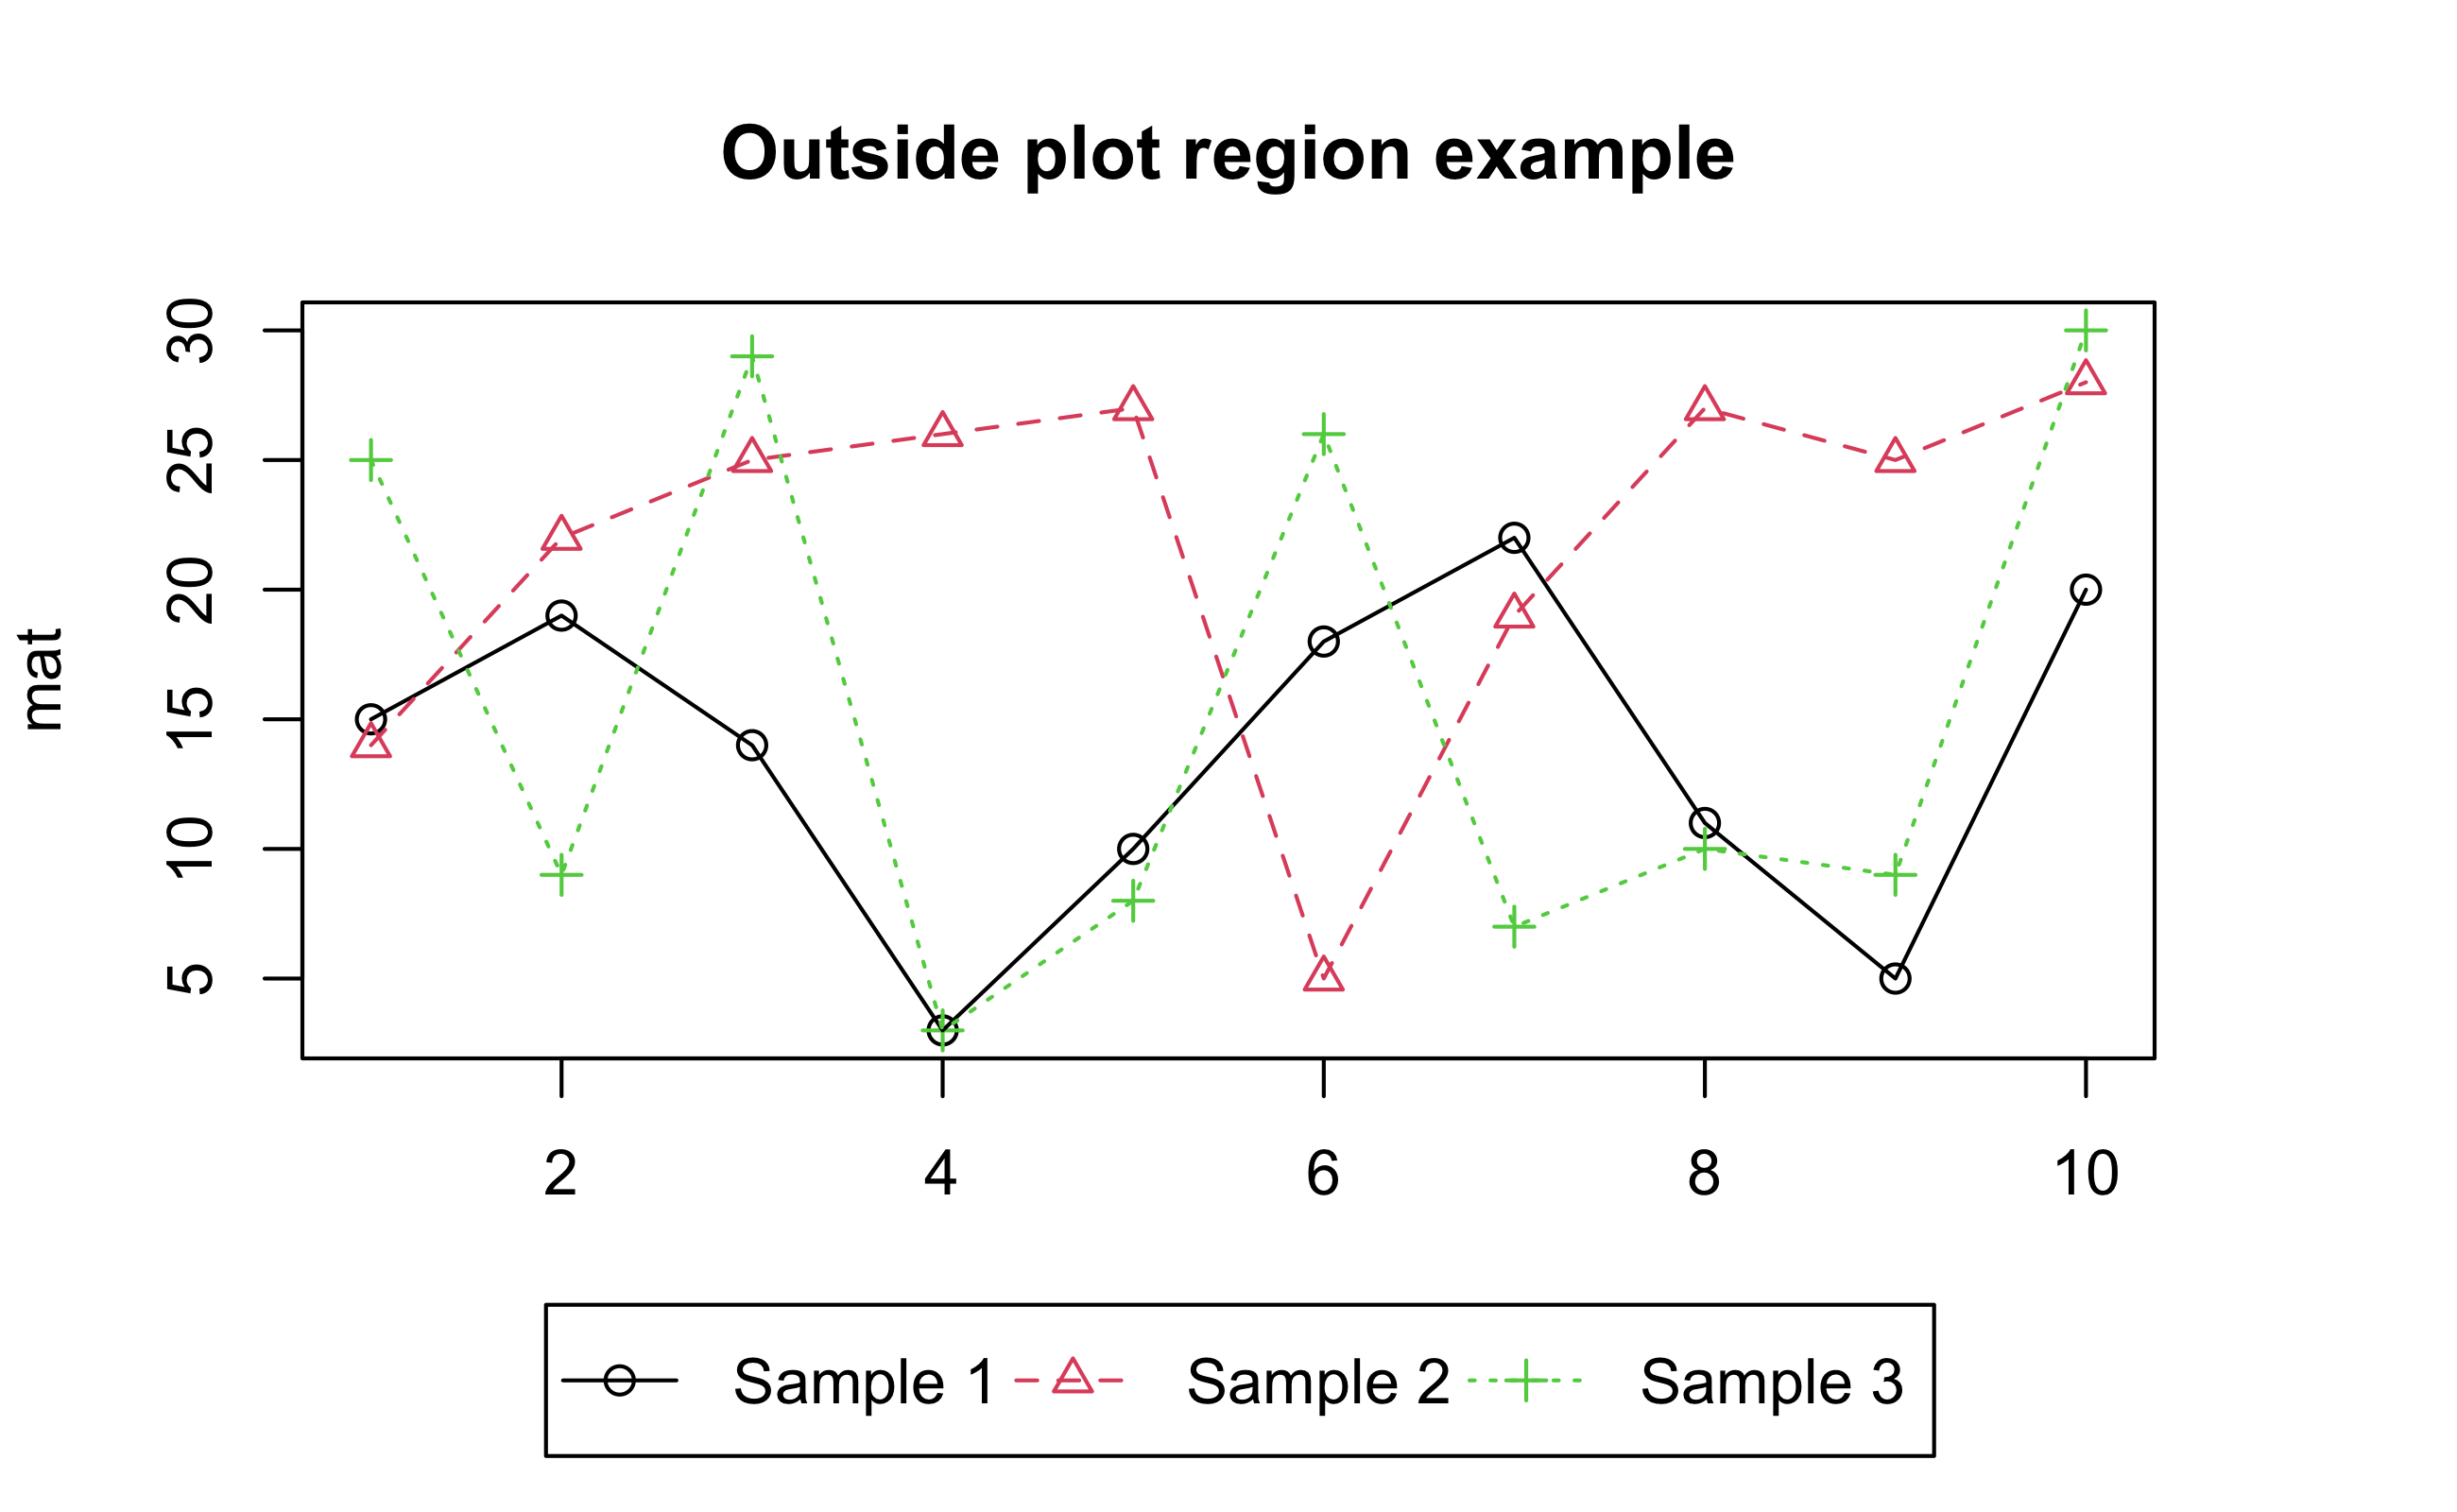
Figure 3: plot region 밖의 legend
그런데 이 예제를 엄밀하게 설명하자면 plot region 밖에 legend를 출력하는 것이 아니라, 다른 figure region의 plot region에 legend를 출력하는 것이다. 그러나 시각적으로 plot region 밖에 legend가 출력된 것처럼 착각하게 된다.