들어가기
R 패키지를 관리하는 CRAN의 지침은 광범위합니다.어떤 패키지는 어렵지 않게 지침을 적용하고, 어떤 패키지는 어렵게 지침을 적용하기도 하겠죠? 패키지의 규모와 관계가 있을겁니다.
제법 커진 패키지를 관리하는 입장에서는 늘 새롭고, 어렵습니다. 그러나 CRAN 매커니즘의 경외감을 느낌니다. 저는 두어개 패키지만 관리하지만 CRAN 관리자는 2만개의 가까운 패키지를 관리하니까요. 이게 오픈소스의 저력일까요?
CRAN에 R 패키지를 제출하는 일
CRAN의 종속성 검사
어느 순간부터 CRAN에 R 패키지를 제출하는 일이 스트레스가 되어 버렸습니다. 거의 dlookr의 새로운 버전을 제출하는 일인데, 이 패키지의 규모가 커지니 여러 이슈가 발생하기 때문입니다.
CRAN의 종속성 검사가 까다로와서, 정상적으로 제출한 후 승인된 후에도 여러 운영체제의 여러 개발환경에서 패키지가 빌드되고 종속성 검사가 진행됩니다. 약 일주일 정도 소요되는 것 같습니다. 그런데 최근에는 정상적으로 진행되는 과정에서 이슈가 발생해서 소스를 수정해서 다시 제출해야하는 상황이 가끔 발생합니다.
며칠전에도 이런 일이 발생하였습니다. 최종적으로 저의 불찰이지만 자꾸 늘어가는 소스코드가 부담됩니다. “가지많은 나무에 바람잘날 없다.”는 격언이 떠오르는 것은 왜일까요? 그래서 파일의 개수와 코드의 라인수를 조사해 보았습니다. 대상은 R 소스파일, 매뉴얼 파일, 마크다운 파일에 한정했습니다.
$ find ./dlookr -name "*.R*" | wc -l
   169
$ find ./dlookr -name "*.R*" -exec cat {} \; | wc -l
   41968
169개의 파일에 소스의 길이가 4만2천 라인에 육박하네요. 이슈가 발생하는 것은 CRAN의 종속성 검사 항목이 증가되고, 강화되는 경향이 있기 때문입니다만 앞으로는 패키지를 기능별로 여러 개로 나누어 개발하는 것을 고려해야할 것 같습니다.
개발버전에서 검증하기
CRAN은 패키지를 제출하기 전에 최신 R-devel(개발버전)에서도 테스트를 수행하라고 강력하게 권장합니다. 마지막으로 제출할 때 사용자에게 체크리스트 답변을 요구하는데, 첫번째 체크사항 중에 볼드체로 기술된 내역입니다.
최근에 저는 패키지의 개발은 현재 R 운영버전에서 개발하고, R 개발버전에서는 아무런 작업을 수행하지 않습니다. MS-Windows와 CentOS 리눅스에서의 교차 테스트도 운영 환경에서 수행했습니다.
매너리즘이라할까요? 예전에는 최신 R-devel에서도 테스트를 수행했지만, 언제부터인지 R-devel에서 테스트를 수행하지 않고 제출하고 있습니다. 문제가 없으리라는 자신감인데, 자만감이라하는 것이 옳겠죠.
이제부터는 최신 R-devel에서도 테스트를 수행해야겠습니다.
deprecated
deprecated에 대해서
dlookr 0.5.5 버전에서 plot_correlate() 함수를 대신할 plot.correlate() 함수를 개발했습니다.
그런데 대체할 plot.correlate() 함수를 만들었다고 기존의 plot_correlate() 함수를 제거하면, 기존 버전을 사용하는 사용자와의 호환성에 문제가 발생합니다.
예를 들면, 기존 패키지를 사용하는 분석가가 plot_correlate() 함수를 사용했다면 새 버전으로 업데이트하고도 기존처럼 plot_correlate() 함수를 사용할겁니다. 이때는 plot_correlate() 함수가 없다는 에러가 발생하겠지요.
R 패키지는 이처럼 대체 함수가 만들어질 때의 혼란을 방지하고자, 기존 함수에 익숙한 사용자를 위해서 일정 기간동안 두 함수를 공존시키는 것을 권장합니다. 그리고 이 변경사항을 사용자에게 안내합니다.
deprecated는 더이상 해당 기능이 사용되지 않음을 사용자에게 고지하는 메커니즘입니다. plot_correlate() 함수로 살펴봅니다.
packageVersion("dlookr")
[1] '0.5.6'library("dlookr", warn.conflicts = FALSE)
plot_correlate(iris)
Warning: 'plot_correlate' is deprecated.
Use 'plot.correlate' instead.
See help("Deprecated")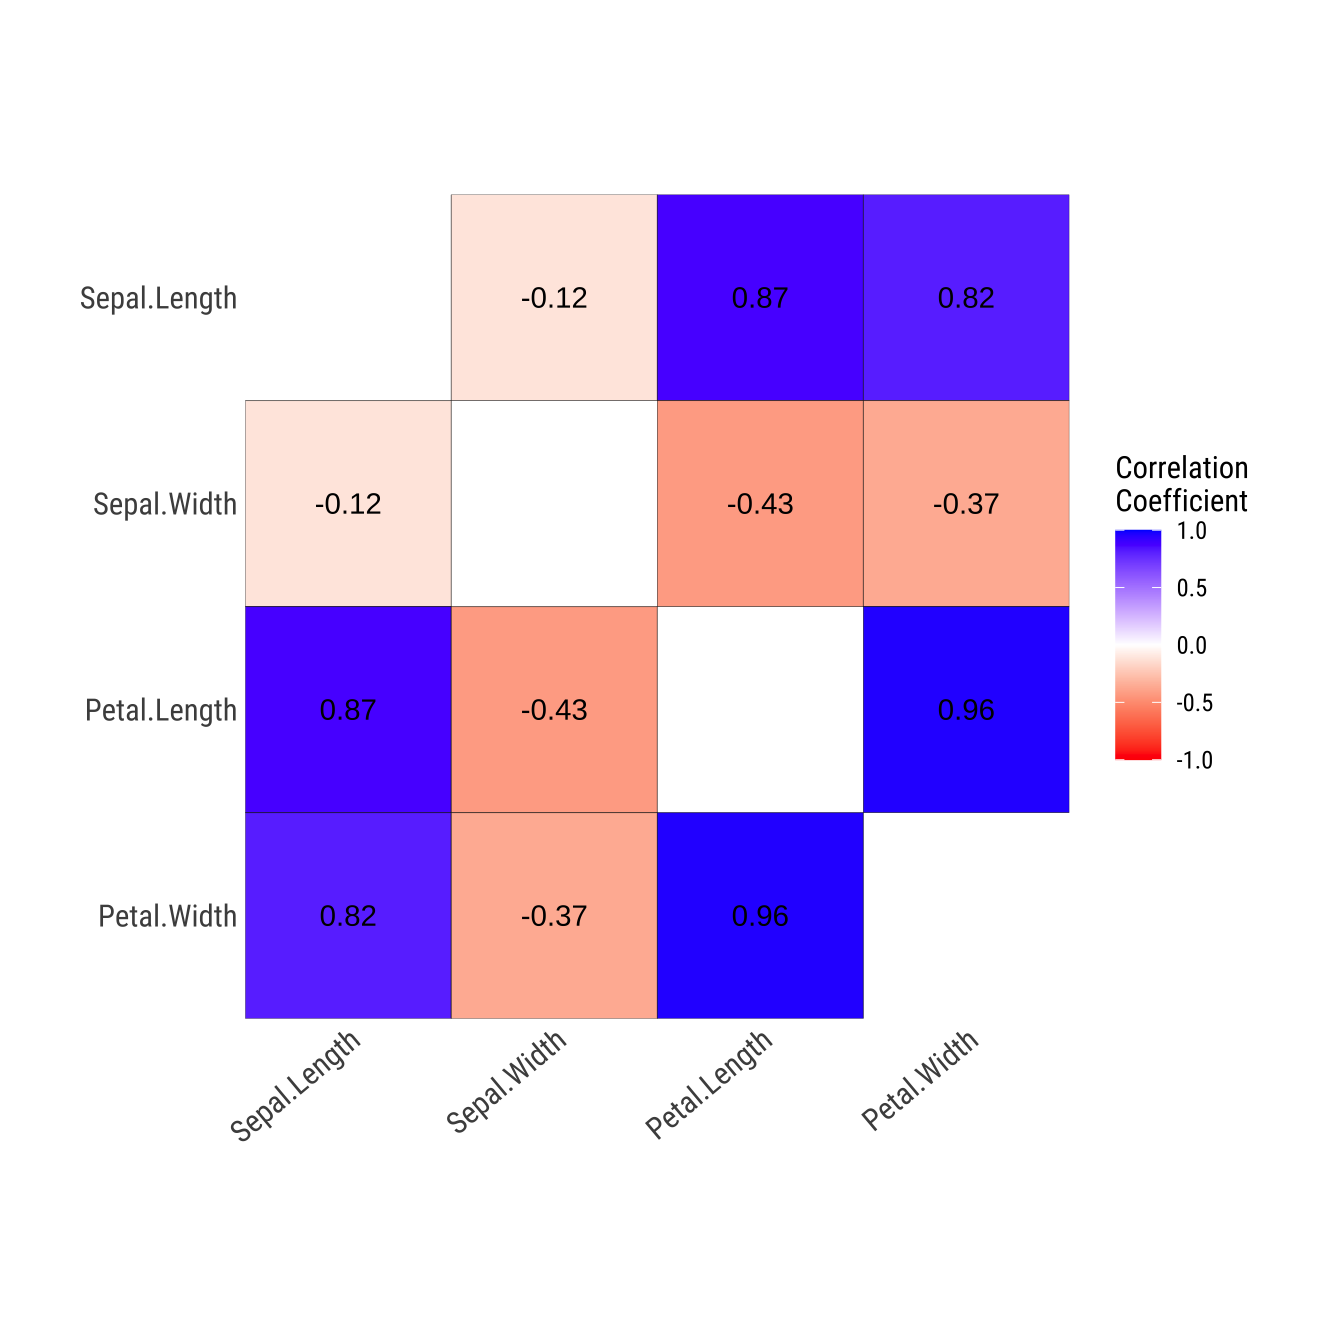
정상적으로 상관행렬 플롯이 시각화되었지만, 경고 메시지가 출력되었습니다. 요약을 하면
“plot_correlate() 함수는 이제 더이상 사용되지 않으니, 대신 plot.correlate() 함수를 사용하라”는 안내입니다.
이 메시지를 접한 분석가는 plot.correlate() 함수를 사용할 것이고, 어느 마이너 업그레이드에서 plot_correlate() 함수가 제거되어도 상관행렬 플롯을 문제없이 시각화할 수 있게 됩니다.
plot.correlate() 함수의 잇점
이번에는 plot.correlate() 함수를 사용해보겠습니다.
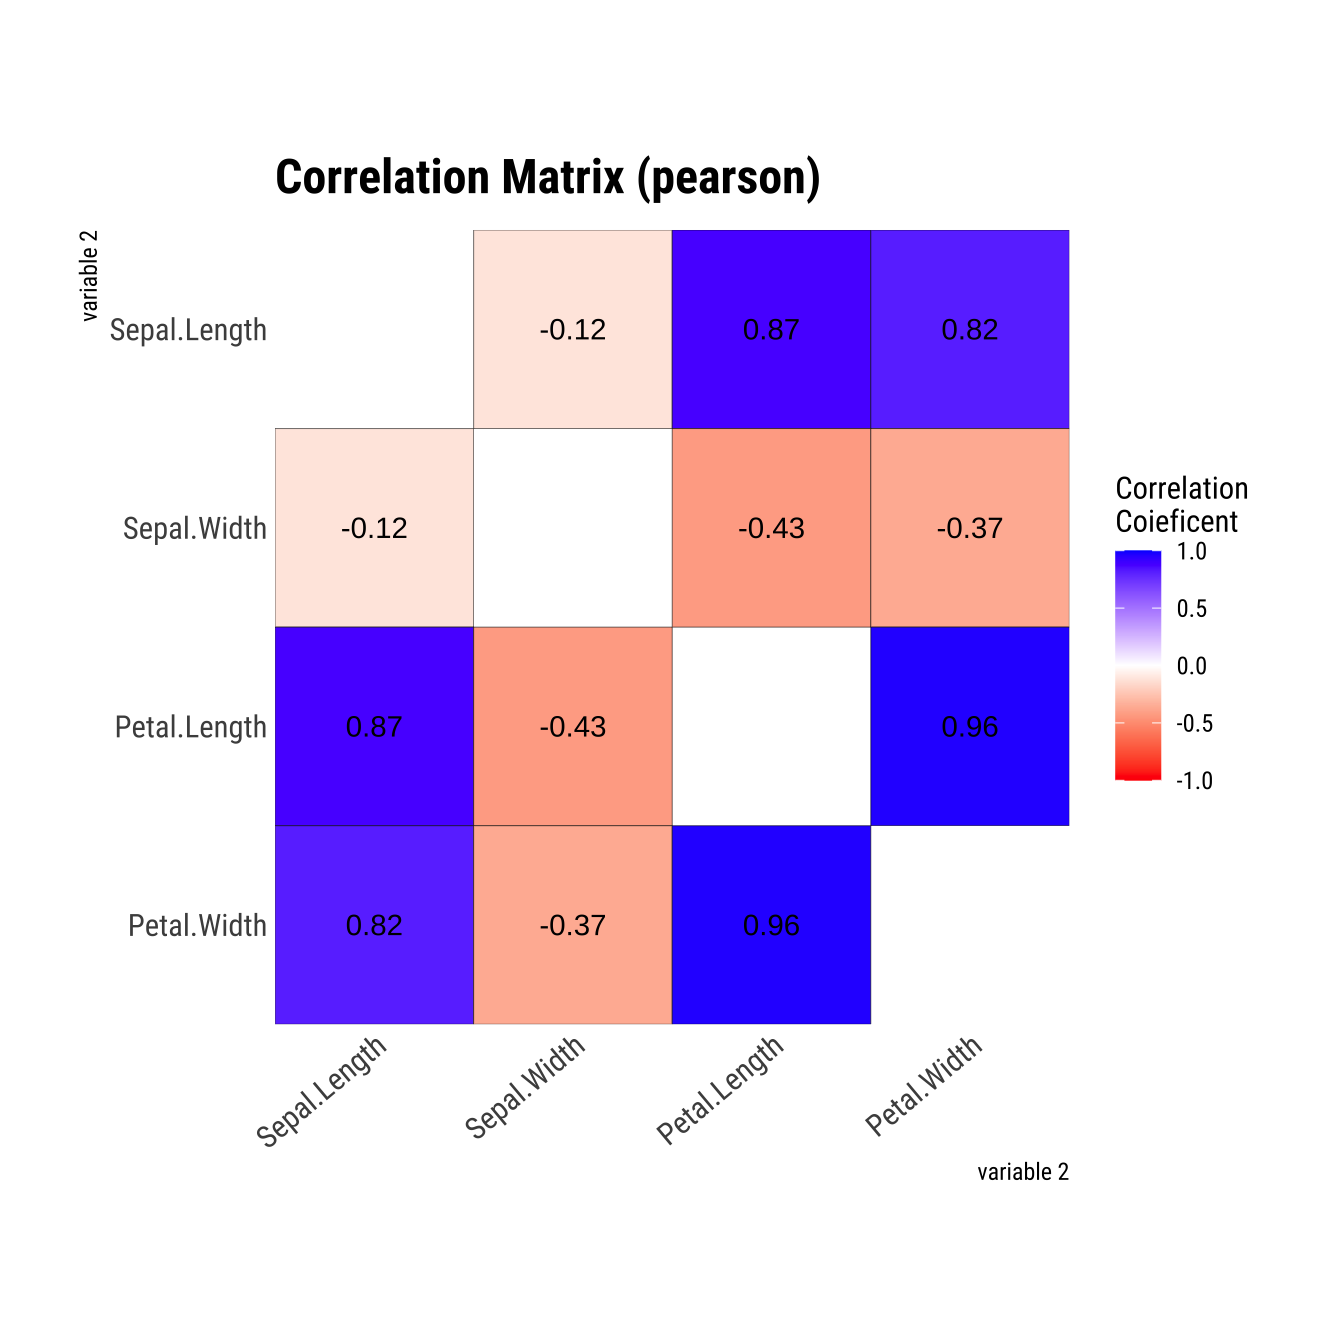
경고 메시지가 없이 정상적으로 상관행렬 플롯이 시각화됩니다. plot.correlate() 함수는 클래스 이름인 correlate를 빼고, 그냥 plot()만 입력해도 동작하는 S3 제너릭 함수입니다. summary(), print() 함수도 같은 제너릭함수입니다.
굳이 plot_correlate() 함수를 대체해서 plot.correlate() 함수를 사용하는 이유는 S3 스팩의 제너릭함수를 사용하는 잇점을 가져가기 때문입니다. correlate() 함수로 correlate 객체를 생성하면 다음처럼 여러 정보를 도출할 수 있습니다. 그러나 plot_correlate() 함수는 오직 시각화만 수행합니다.
is(corr_iris)
[1] "correlate"corr_iris
# A tibble: 12 × 3
   var1         var2         coef_corr
   <fct>        <fct>            <dbl>
 1 Sepal.Width  Sepal.Length    -0.118
 2 Petal.Length Sepal.Length     0.872
 3 Petal.Width  Sepal.Length     0.818
 4 Sepal.Length Sepal.Width     -0.118
 5 Petal.Length Sepal.Width     -0.428
 6 Petal.Width  Sepal.Width     -0.366
 7 Sepal.Length Petal.Length     0.872
 8 Sepal.Width  Petal.Length    -0.428
 9 Petal.Width  Petal.Length     0.963
10 Sepal.Length Petal.Width      0.818
11 Sepal.Width  Petal.Width     -0.366
12 Petal.Length Petal.Width 0.963print(corr_iris)
# A tibble: 12 × 3
   var1         var2         coef_corr
   <fct>        <fct>            <dbl>
 1 Sepal.Width  Sepal.Length    -0.118
 2 Petal.Length Sepal.Length     0.872
 3 Petal.Width  Sepal.Length     0.818
 4 Sepal.Length Sepal.Width     -0.118
 5 Petal.Length Sepal.Width     -0.428
 6 Petal.Width  Sepal.Width     -0.366
 7 Sepal.Length Petal.Length     0.872
 8 Sepal.Width  Petal.Length    -0.428
 9 Petal.Width  Petal.Length     0.963
10 Sepal.Length Petal.Width      0.818
11 Sepal.Width  Petal.Width     -0.366
12 Petal.Length Petal.Width 0.963summary(corr_iris)
* correlation type   : generic
* variable type      : numeric
* correlation method : pearson

* Matrix of Correlation
             Sepal.Length Sepal.Width Petal.Length Petal.Width
Sepal.Length    1.0000000  -0.1175698    0.8717538   0.8179411
Sepal.Width    -0.1175698   1.0000000   -0.4284401  -0.3661259
Petal.Length    0.8717538  -0.4284401    1.0000000   0.9628654
Petal.Width     0.8179411  -0.3661259    0.9628654   1.0000000
plot_correlate() 함수는 먼저 상관행렬을 구한다음, 상관행렬은 ggplot2 패키지로 시각화합니다. 데이터의 규모가 커질수록 상관행렬을 계산하는 비용이 커집니다. 그런데 어렵계 계산한(큰 규모의 데이터 셋으로 제접 오랜 시간 걸려서 계산한) 상관행렬 정보를 시각화한 다음에 버리기에는 아깝습니다.
dlookr은 correlate() 함수로 상관계수 테이블을 계산한 후 correlate 클래스를 만듭니다. 그리고 이 클래스 객체로 상관행렬 테이블(tibble 객체)을 조회하고, 상관계수 상관행렬을 조화하고, 시각화할 수 있습니다. 아주 유용한 재활용 방법입니다. 그래서 시각화를 위한 plot_correlate() 함수를 더이상 유지하지 않고, plot.correlate() 함수로 대체하려는 것입니다.
deprecated 적용하기
다음처럼 .Deprecated() 함수에 대체할 함수를 기술하면 됩니다. 이제 패키지가 빌드되면, plot_correlate() 패키지는 더이상 사용되지 않는 함수가 됩니다. 그리고 호출될 경우 사용자에게 삭제될 함수임을 알려주어서 더이상 사용하지 않고 대체 함수를 사용할 기회를 줍니다.
향후 계획
어느 정도 유예기간을 주고, 추후 패키지 업그레이드시에 더이상 사용되지 않는 함수를 제거하게 됩니다.
CRAN 종속성 검사 오류
문제의 인식
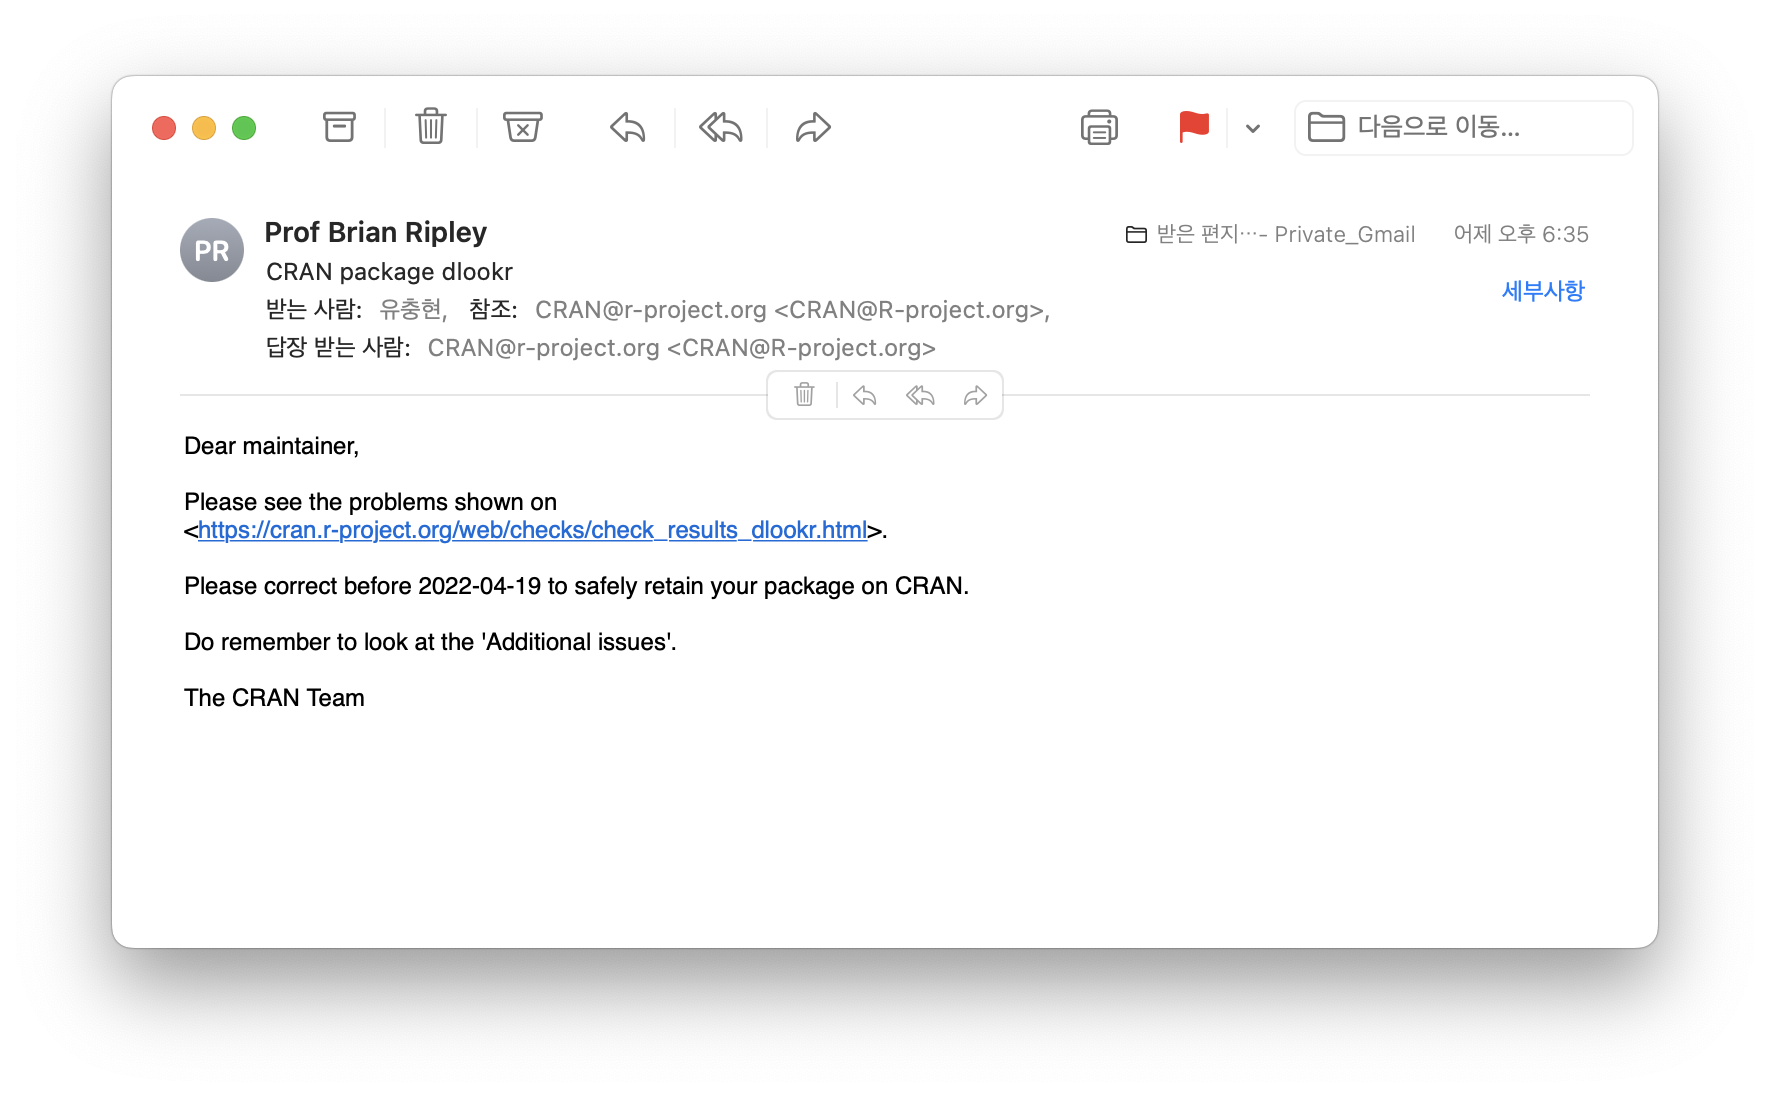
더이상 사용되지 않는 함수로 분류한 plot_correlate() 함수로 인해서, Brian Ripley 교수로부터 메일을 받았습니다.
2022-04-19까지 문제를 수정하지 않으면, CRAN에서 퇴출될 수 있습니다.
문제의 원인
CRAN의 패키지 사이트에서 dlookr의 종속성 검사 결과 화면을 살펴봅니다.
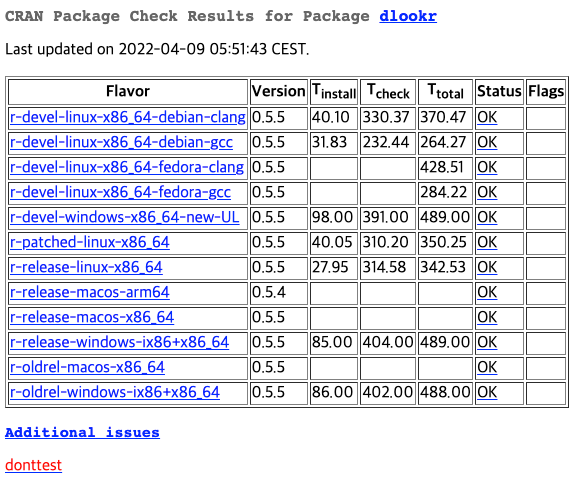
테이블에 있는 상태는 정상이지만, 아래에 “Additional issue”과 “dontetest” 링크가 생성되어 있습니다.
“Additional issue” 메뉴로 들어가면 다음과 같은 화면을 확인할 수 있습니다. CRAN에서 종속성 검사 항목에 추가하여 검사하는 항목들입니다. 모든 패키지에 대해서 검사하는 항목들이 아니라, 조건을 만족할 때 추가로 검사하는 항목들입니다.
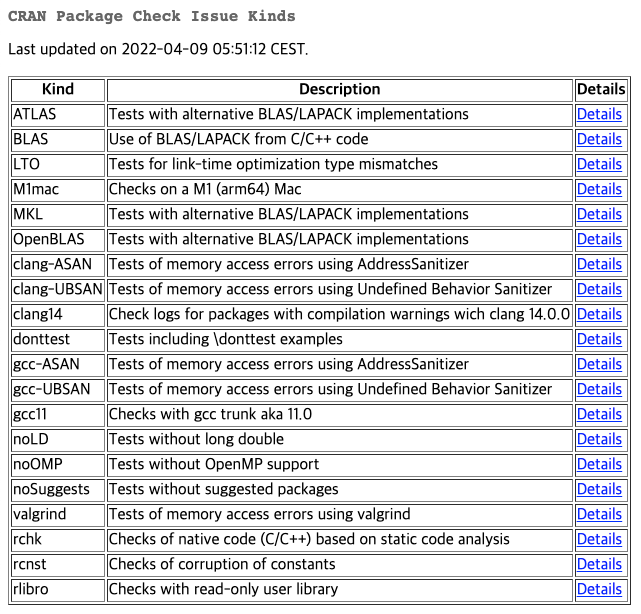
문제가 발생한 “donttest”의 설명이 “Tests including \donttest examples”로 출력되어 있습니다. 함수의 도움말을 기술할 때, \donttest 태그가 있을 경우에 검사하는 항목입니다.
다시 dlookr의 종속성 검사 결과 화면으로 돌아와서, “dontetest” 링크를 타고 들어가 다음과 같은 경고 메시지를 발견합니다.
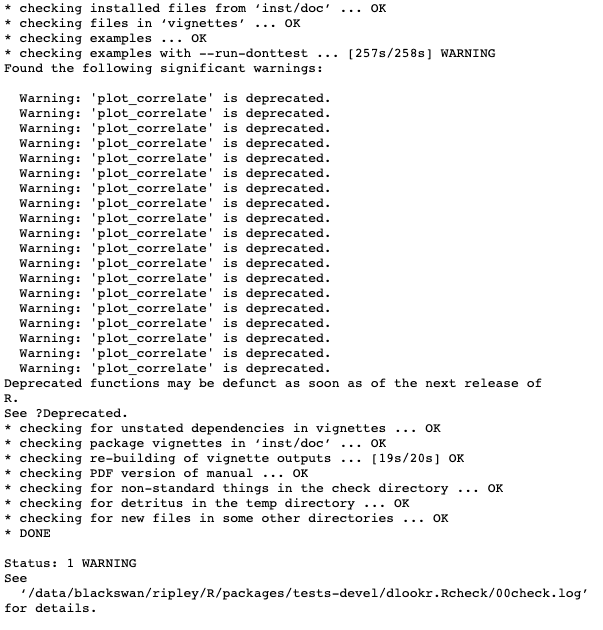
더이상 사용되지 않는 함수인 plot_correlate() 함수가 도움말 페이지에서 호출되면서 출력되는 경고 메시 때문에 이슈가 발생한 것입니다. 두 개의 도움말 파일에서 모두 19번의 plot_correlate() 함수 호출이 그대로 로깅되었습니다.
“더이상 사용되지 않는 함수이면서 앞으로는 없어질 함수를 왜 도움말 페이지를 만들어서 예제까지 설명해야 하나?” 이것이 CRAN의 입장인 것입니다.
문제의 해결
다음과 같은 방법으로 문제를 해결하였습니다.
- dlookr-deprecated 도움말 생성
더이상 사용되지 않는 함수에 대한 설명 및 해당 함수와 대체 사용설명
더이상 사용되지 않는 함수의 도움말에서 예제를 제거더이상 사용되지 않는 함수도움말을 패키지 도움말 목록에서 제거
dlookr-deprecated 도움말 생성
dlookr-deprecated 도움말을 생성하기 위한 Roxygen 파일을 다음처럼 dlookr-deprecated.R이라는 이름으로 생성하였습니다.
## dlookr-deprecated.R
#' @title Deprecated functions in package \sQuote{dlookr}
#' @description
#' These functions are provided for compatibility with older versions
#' of \sQuote{dlookr} only, and will be defunct at the next release.
#' @details
#' The following functions are deprecated and will be made defunct; use
#' the replacement indicated below:
#' \itemize{
#'  \item{plot_correlate: \code{\link{plot.correlate}}}
#' }
#' @name dlookr-deprecated
NULL
Roxygen 파일을 검파일하면 다음과 같은 도움말 파일이 생성됩니다.
% Generated by roxygen2: do not edit by hand
% Please edit documentation in R/correlate.R, R/dlookr-deprecated.R
\name{plot_correlate}
\alias{plot_correlate}
\alias{dlookr-deprecated}
\title{Deprecated functions in package \sQuote{dlookr}}
\usage{
plot_correlate(.data, ...)
}
\description{
These functions are provided for compatibility with older versions
of \sQuote{dlookr} only, and will be defunct at the next release.
}
\details{
The following functions are deprecated and will be made defunct; use
the replacement indicated below:
\itemize{
\item{plot_correlate: \code{\link{plot.correlate}}}
}
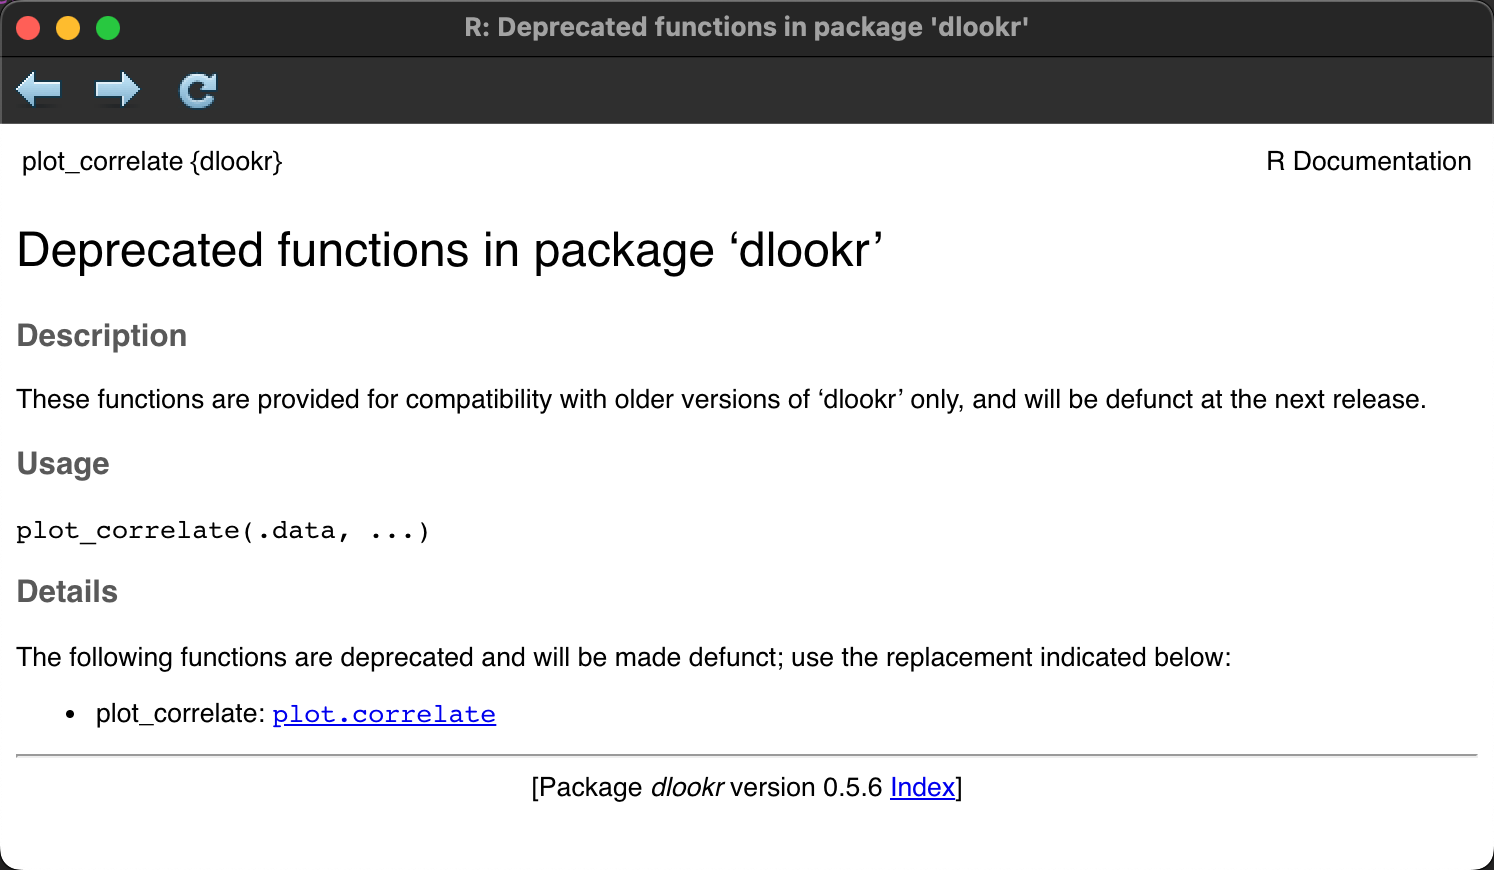
}그리고 최종으로 생성되는 도움말은 다음과 같이 두 가지 명령으로 호출할 수 있습니다.
? plot_correlate
? "dlookr-deprecated"
더이상 사용되지 않는 함수 도움말 수정
더이상 사용되지 않는 함수 도움말은 다음과 같이 수정했습니다. Roxygen 태그입니다.
예제 섹션을 삭제해서 예제가 보이지 않고, @keywords internal 태그를 추가해서 패키지의 도움말 목록에서는 제거됩니다. 그러므로 미아가 된 것입니다. 도움말을 조회할 수 없기 때문입니다. 아예 도움말을 생성하지 않을수도 있으나, 만약을 위해서 남겨두었습니다.
#' Visualize correlation plot of numerical data
#'
#' @description
#' The plot_correlate() visualize correlation plot
#' for find relationship between two numerical variables.
#'
#' @details The scope of the visualization is the provide a correlation information.
#' Since the plot is drawn for each variable, if you specify more than
#' one variable in the ... argument, the specified number of plots are drawn.
#'
#' The direction of the diagonal is top-left to bottom-right. and color of the
#' cells is 'red' to -1, 'blue' to 1.
#'
#' The base_family is selected from "Roboto Condensed", "Liberation Sans Narrow",
#' "NanumSquare", "Noto Sans Korean". If you want to use a different font,
#' use it after loading the Google font with import_google_font().
#'
#' @param .data a data.frame or a \code{\link{tbl_df}}.
#' @param method a character string indicating which correlation coefficient (or covariance) is
#' to be computed. One of "pearson" (default), "kendall", or "spearman": can be abbreviated.
#' @param typographic logical. Whether to apply focuses on typographic elements to ggplot2 visualization.
#' The default is TRUE. if TRUE provides a base theme that focuses on typographic elements using hrbrthemes package.
#' @param base_family character. The name of the base font family to use
#' for the visualization. If not specified, the font defined in dlookr is applied. (See details)
#' @param ... one or more unquoted expressions separated by commas.
#' You can treat variable names like they are positions.
#' Positive values select variables; negative values to drop variables.
#' If the first expression is negative, plot_correlate() will automatically start with all variables.
#' These arguments are automatically quoted and evaluated in a context where column names
#' represent column positions.
#' They support unquoting and splicing.
#'
#' See vignette("EDA") for an introduction to these concepts.
#'
#' @seealso \code{\link{plot_correlate.tbl_dbi}}, \code{\link{plot_outlier.data.frame}}.
#' @export
#' @method plot_correlate data.frame
#' @importFrom tidyselect vars_select
#' @importFrom rlang quos
#' @export
#' @keywords internal
plot_correlate.data.frame <- function(.data, ...,
                                      method = c("pearson", "kendall", "spearman"),
                                      typographic = TRUE, base_family = NULL) {
  vars <- tidyselect::vars_select(names(.data), !!! rlang::quos(...))
  method <- match.arg(method)

  plot_correlate_impl(.data, vars, method, typographic, base_family)
}
추가로 진행해야할 작업
CRAN에서는 체크하지 않지만, 다음과 같이 추가로 진행해야할 작업 있습니다.
- Vignettes 문서에서 plot_correlate() 사용 방법을 plot.correlate()로 대체
- EDA 문서 생성하는 기능의 로직에서 plot_correlate() 호출을 plot.correlate() 호출로 대체
에필로그
호환성을 유지하면서 패키지를 관리하는 것이 쉽지는 않습니다만, 변명의 여지가 없는 이슈가 발생하였습니다. 사실 저의 지식 안에서 작업을 수행한 것이었습니다. 이처럼 새로운 기능이 추가되거나 시도가 있을 때마다 위험요소가 존재합니다. 좀더 신중을 기해서 패키지 관리에 임해야겠습니다.
이 기회에 deprecated의 기능에 대해서 충분히 숙지했습니다. 그러나 늘 있는 작업이 아니라 메모 차원에서 포스트로 경험을 남겼습니다.
아쉬운 점은 lifecycle 패키지를 사용하면, 쉽고 효율적으로 함수의 수명 주기를 관리할 수 있는데 사용하지 못한 점입니다. 왜냐하면 dlookr 패키지는 20개의 패키지를 참조하고 있기 때문에, 더이상 다른 패키지를 사용할 수 없기 때문입니다. CRAN은 타 패키지 참조의 개수를 20개로 제한하고 있습니다.
패키지에서 객체의 수명주기 관리에 관심있는 R 패키지 개발자는 lifecycle 패키지를 사용해 보시기 바랍니다.