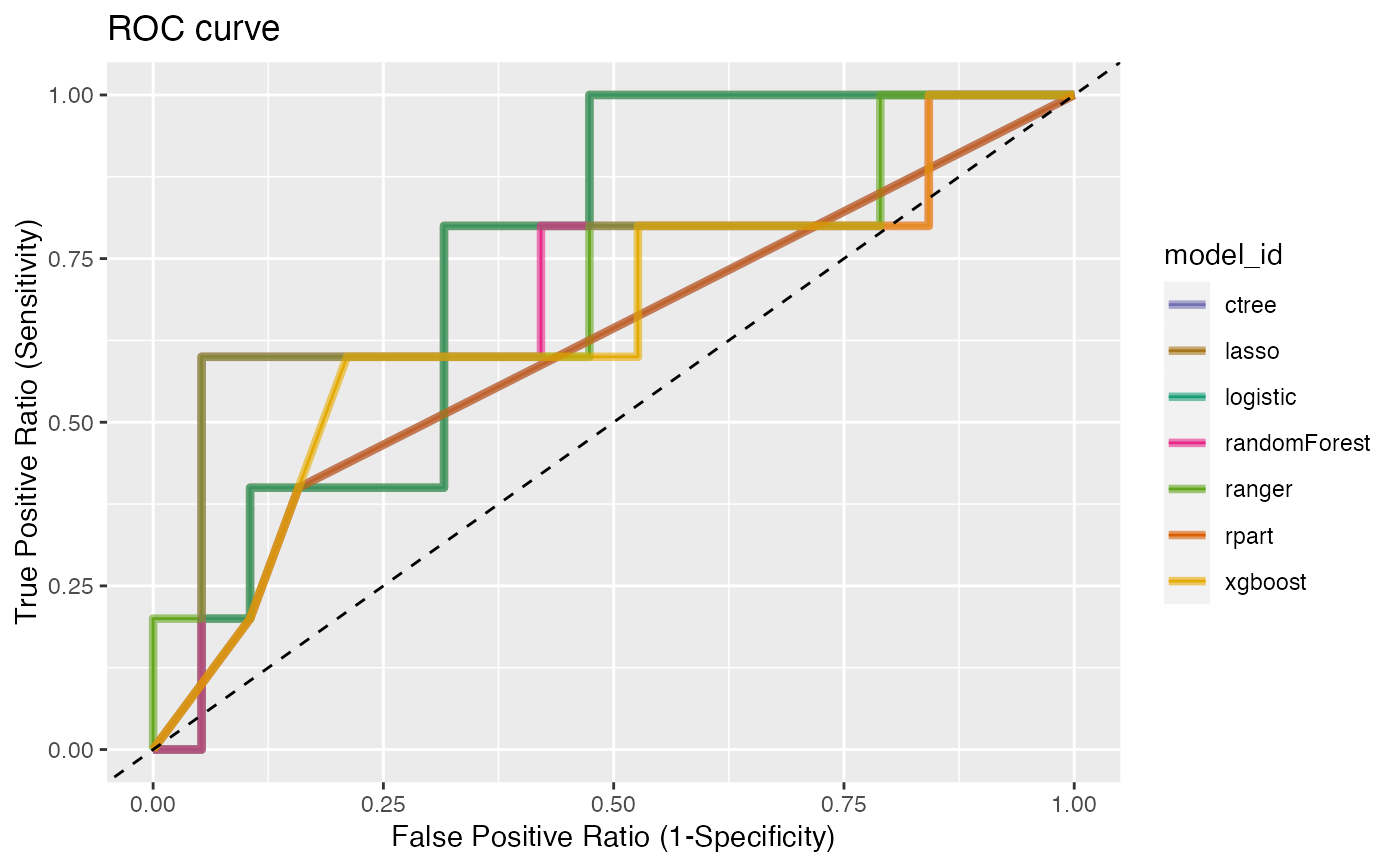
plot_performance() visualizes a plot to ROC curve that separates model algorithm.
plot_performance(model)Arguments
- model
A model_df. results of predicted model that created by run_predict().
Value
There is no return value. Only the plot is drawn.
Details
The ROC curve is output for each model included in the model_df class object specified as a model argument.
Examples
# \donttest{
library(dplyr)

# Divide the train data set and the test data set.
sb <- rpart::kyphosis %>%
  split_by(Kyphosis)

# Extract the train data set from original data set.
train <- sb %>%
  extract_set(set = "train")

# Extract the test data set from original data set.
test <- sb %>%
  extract_set(set = "test")

# Sampling for unbalanced data set using SMOTE(synthetic minority over-sampling technique).
train <- sb %>%
  sampling_target(seed = 1234L, method = "ubSMOTE")

# Cleaning the set.
train <- train %>%
  cleanse
#> ── Checking unique value ─────────────────────────── unique value is one ──
#> No variables that unique value is one.
#>
#> ── Checking unique rate ─────────────────────────────── high unique rate ──
#> No variables that high unique rate.
#>
#> ── Checking character variables ─────────────────────── categorical data ──
#> No character variables.
#>
#>

# Run the model fitting.
result <- run_models(.data = train, target = "Kyphosis", positive = "present")

# Predict the model.
pred <- run_predict(result, test)

# Plot ROC curve
plot_performance(pred)

# }
# }