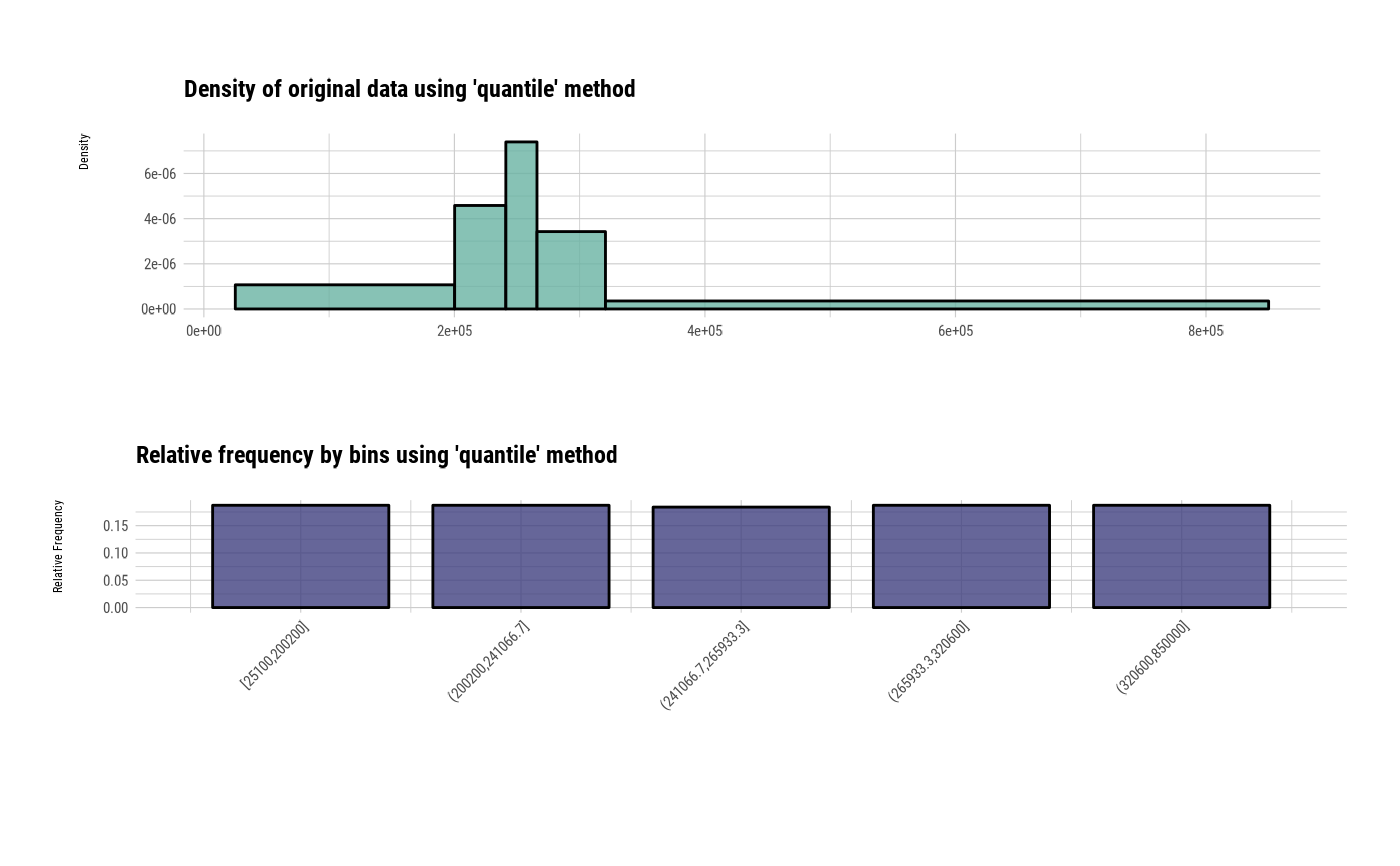
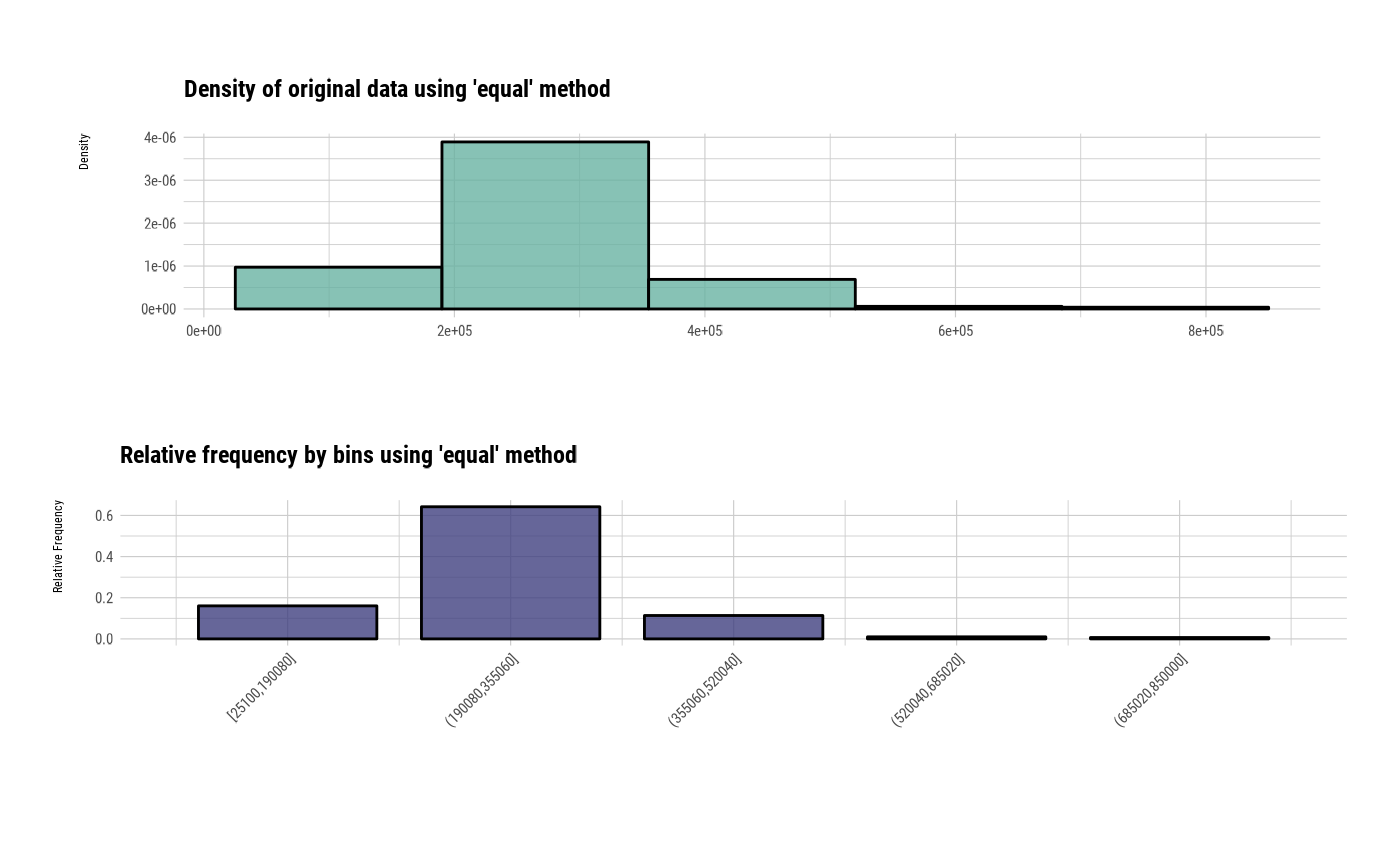
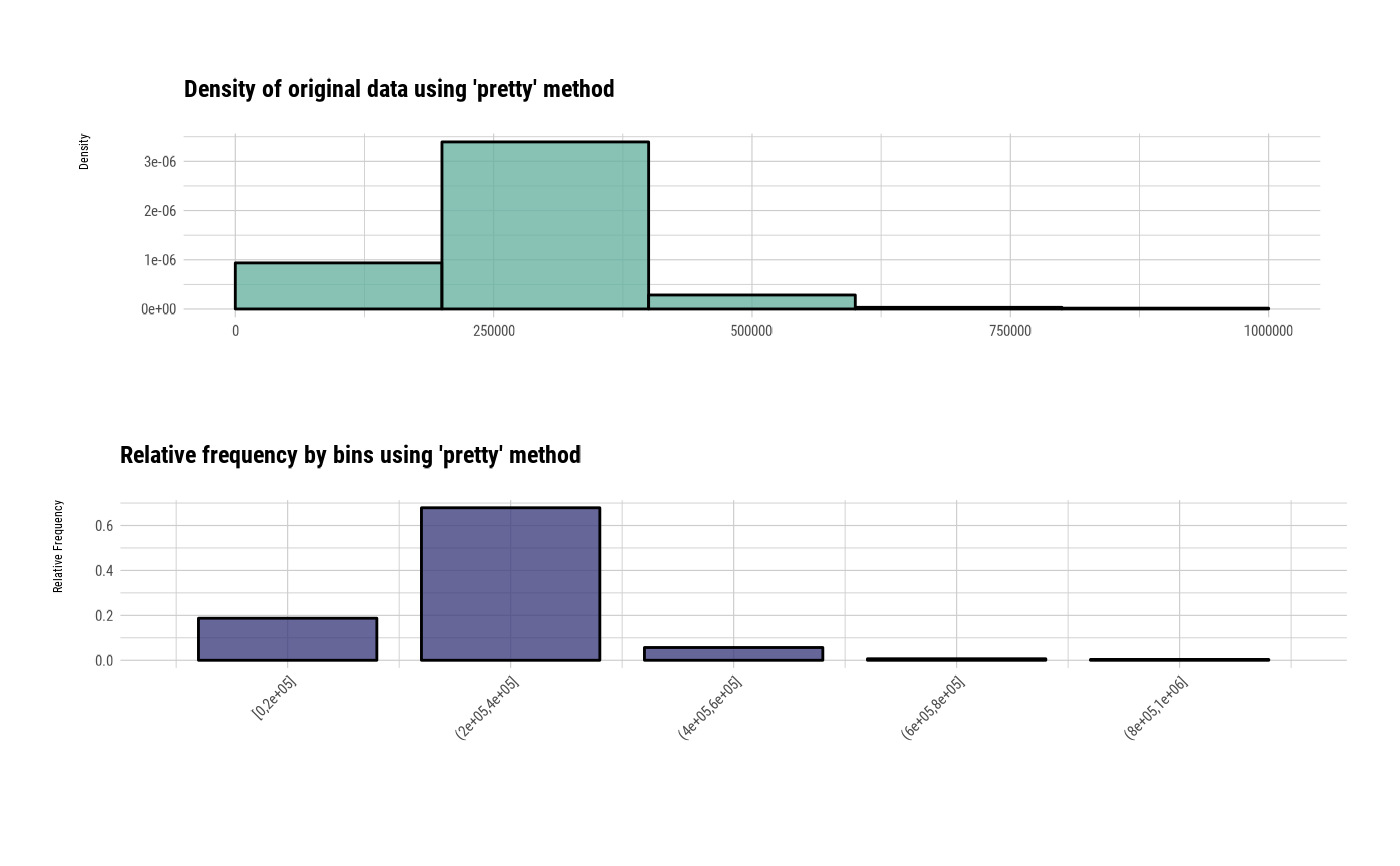
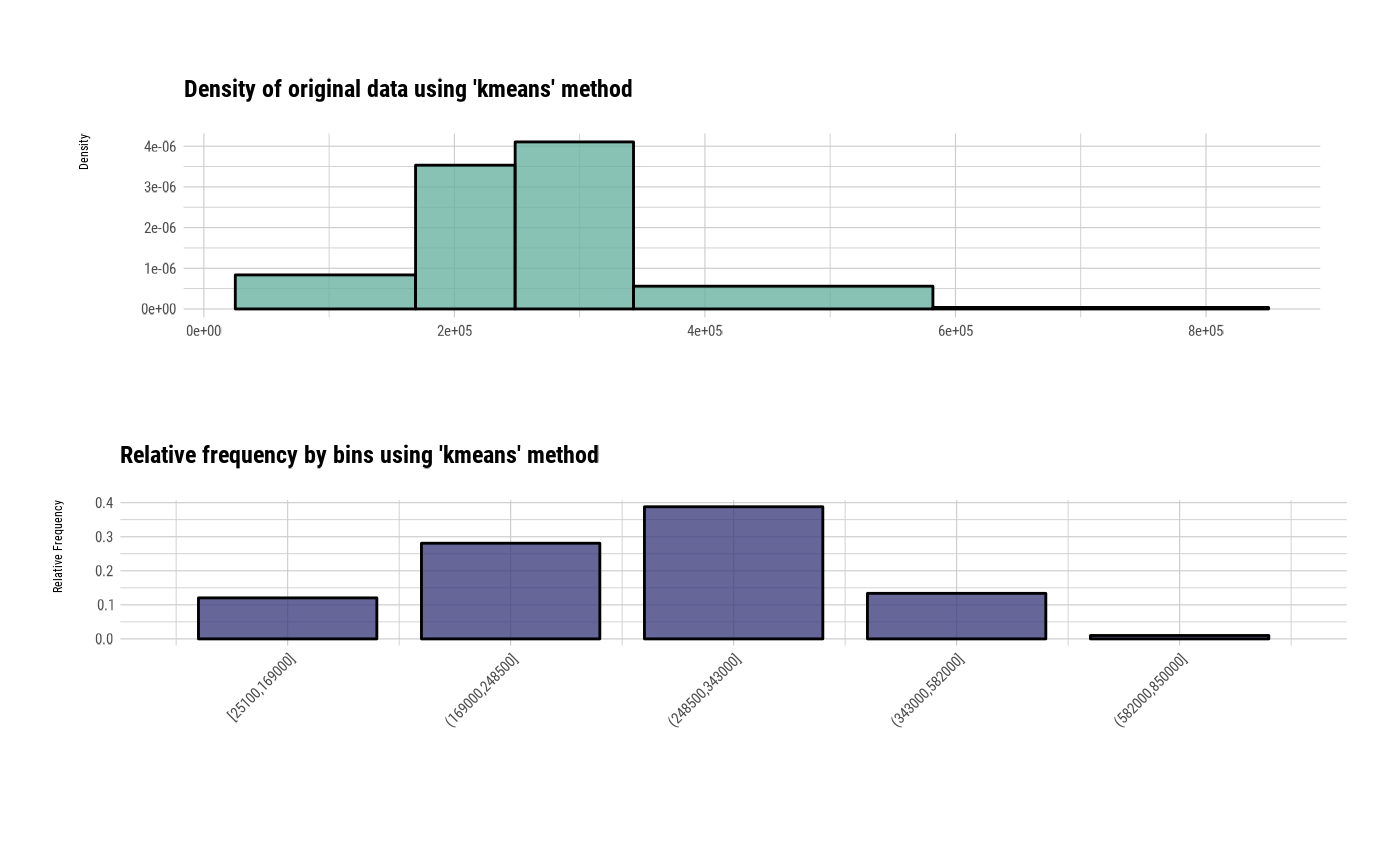
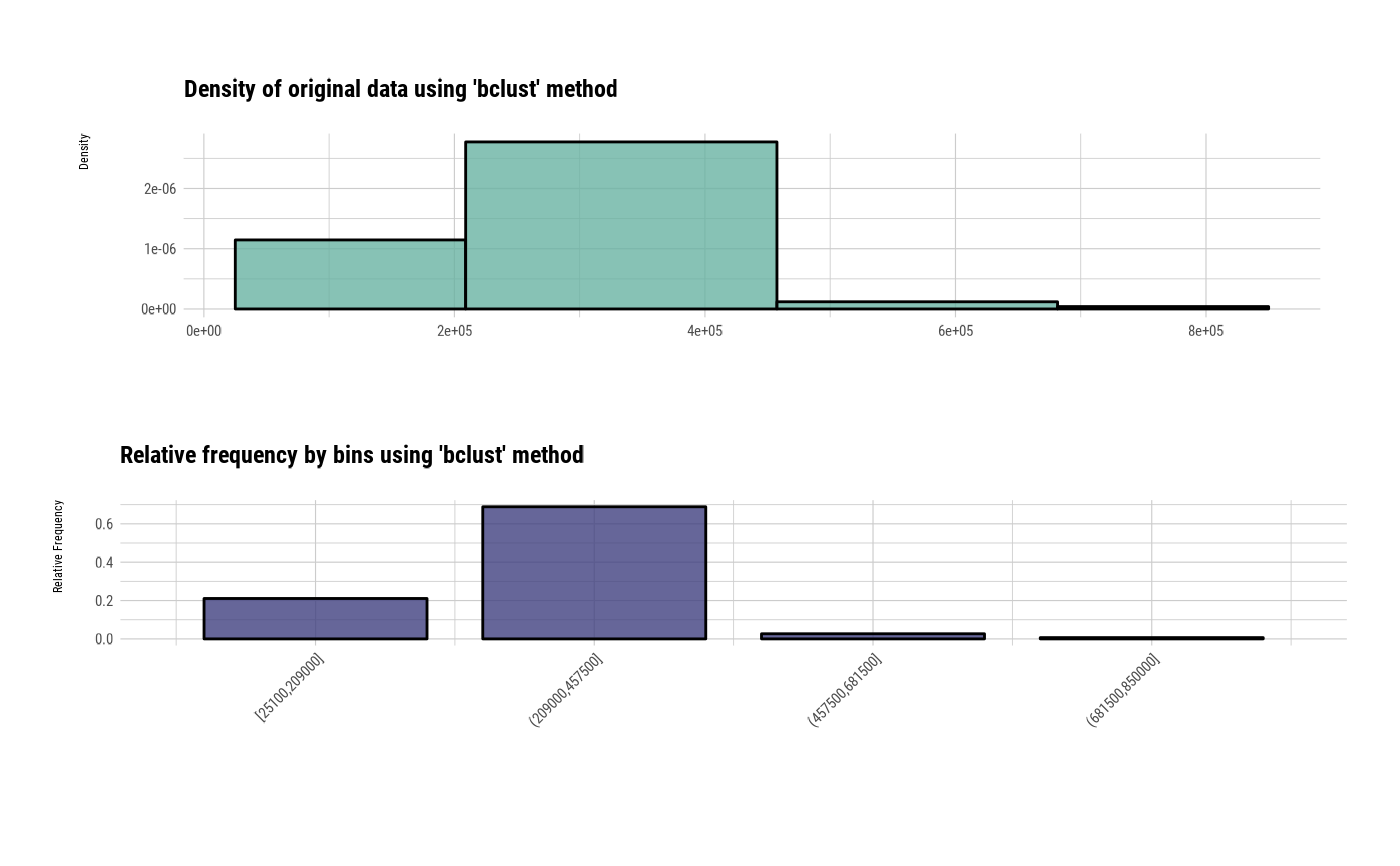
Visualize two plots on a single screen. The plot at the top is a histogram representing the frequency of the level. The plot at the bottom is a bar chart representing the frequency of the level.
# S3 method for class 'bins'
plot(x, typographic = TRUE, base_family = NULL, ...)
Arguments
- x
an object of class "bins", usually, a result of a call to binning().
- typographic
logical. Whether to apply focuses on typographic elements to ggplot2 visualization. The default is TRUE. if TRUE provides a base theme that focuses on typographic elements.
- base_family
character. The name of the base font family to use for the visualization. If not specified, the font defined in dlookr is applied. (See details)
- ...
arguments to be passed to methods, such as graphical parameters (see par).
Value
An object of gtable class.
Details
The base_family is selected from "Roboto Condensed", "Liberation Sans Narrow", "NanumSquare", "Noto Sans Korean". If you want to use a different font, use it after loading the Google font with import_google_font().
See also
Examples
# Generate data for the example
# \donttest{
heartfailure2 <- heartfailure
heartfailure2[sample(seq(NROW(heartfailure2)), 20), "platelets"] <- NA
# Binning the platelets variable. default type argument is "quantile"
bin <- binning(heartfailure2$platelets, nbins = 5)
plot(bin)
#> Don't know how to automatically pick scale for object of type <table>.
#> Defaulting to continuous.
 # Using another type arguments
bin <- binning(heartfailure2$platelets, nbins = 5, type = "equal")
plot(bin)
#> Don't know how to automatically pick scale for object of type <table>.
#> Defaulting to continuous.
# Using another type arguments
bin <- binning(heartfailure2$platelets, nbins = 5, type = "equal")
plot(bin)
#> Don't know how to automatically pick scale for object of type <table>.
#> Defaulting to continuous.
 bin <- binning(heartfailure2$platelets, nbins = 5, type = "pretty")
plot(bin)
#> Don't know how to automatically pick scale for object of type <table>.
#> Defaulting to continuous.
bin <- binning(heartfailure2$platelets, nbins = 5, type = "pretty")
plot(bin)
#> Don't know how to automatically pick scale for object of type <table>.
#> Defaulting to continuous.
 # "kmeans" and "bclust" was implemented by classInt::classIntervals() function.
# So, you must install classInt package.
if (requireNamespace("classInt", quietly = TRUE)) {
bin <- binning(heartfailure2$platelets, nbins = 5, type = "kmeans")
plot(bin)
bin <- binning(heartfailure2$platelets, nbins = 5, type = "bclust")
plot(bin)
}
#> Don't know how to automatically pick scale for object of type <table>.
#> Defaulting to continuous.
# "kmeans" and "bclust" was implemented by classInt::classIntervals() function.
# So, you must install classInt package.
if (requireNamespace("classInt", quietly = TRUE)) {
bin <- binning(heartfailure2$platelets, nbins = 5, type = "kmeans")
plot(bin)
bin <- binning(heartfailure2$platelets, nbins = 5, type = "bclust")
plot(bin)
}
#> Don't know how to automatically pick scale for object of type <table>.
#> Defaulting to continuous.
 #> Don't know how to automatically pick scale for object of type <table>.
#> Defaulting to continuous.
#> Don't know how to automatically pick scale for object of type <table>.
#> Defaulting to continuous.
 # }
# }