Visualize by attribute of `correlate` class. The plot of correlation matrix is a tile plot.
# S3 method for class 'correlate'
plot(x, typographic = TRUE, base_family = NULL, ...)
Arguments
- x
an object of class "correlate", usually, a result of a call to correlate().
- typographic
logical. Whether to apply focuses on typographic elements to ggplot2 visualization. The default is TRUE. if TRUE provides a base theme that focuses on typographic elements.
- base_family
character. The name of the base font family to use for the visualization. If not specified, the font defined in dlookr is applied. (See details)
- ...
arguments to be passed to methods, such as graphical parameters (see par).
Value
No return value. This function is called for its side effect, which is to produce a plot on the current graphics device.
Details
The base_family is selected from "Roboto Condensed", "Liberation Sans Narrow", "NanumSquare", "Noto Sans Korean". If you want to use a different font, use it after loading the Google font with import_google_font().
See also
Examples
# \donttest{
library(dplyr)
# correlate type is generic ==================================
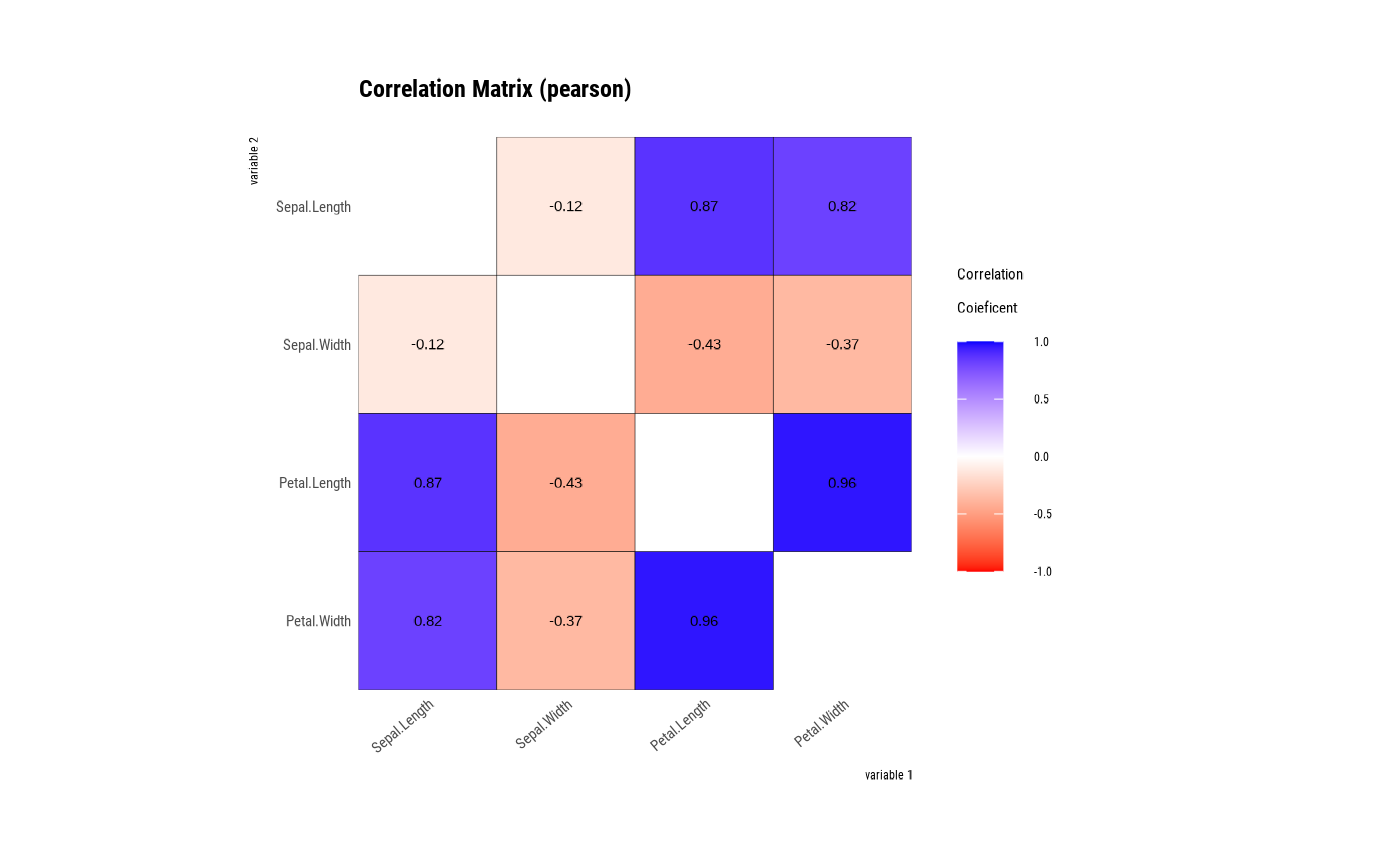
tab_corr <- correlate(iris)
tab_corr
#> # A tibble: 12 × 3
#> var1 var2 coef_corr
#> <fct> <fct> <dbl>
#> 1 Sepal.Width Sepal.Length -0.118
#> 2 Petal.Length Sepal.Length 0.872
#> 3 Petal.Width Sepal.Length 0.818
#> 4 Sepal.Length Sepal.Width -0.118
#> 5 Petal.Length Sepal.Width -0.428
#> 6 Petal.Width Sepal.Width -0.366
#> 7 Sepal.Length Petal.Length 0.872
#> 8 Sepal.Width Petal.Length -0.428
#> 9 Petal.Width Petal.Length 0.963
#> 10 Sepal.Length Petal.Width 0.818
#> 11 Sepal.Width Petal.Width -0.366
#> 12 Petal.Length Petal.Width 0.963
# visualize correlate class
plot(tab_corr)
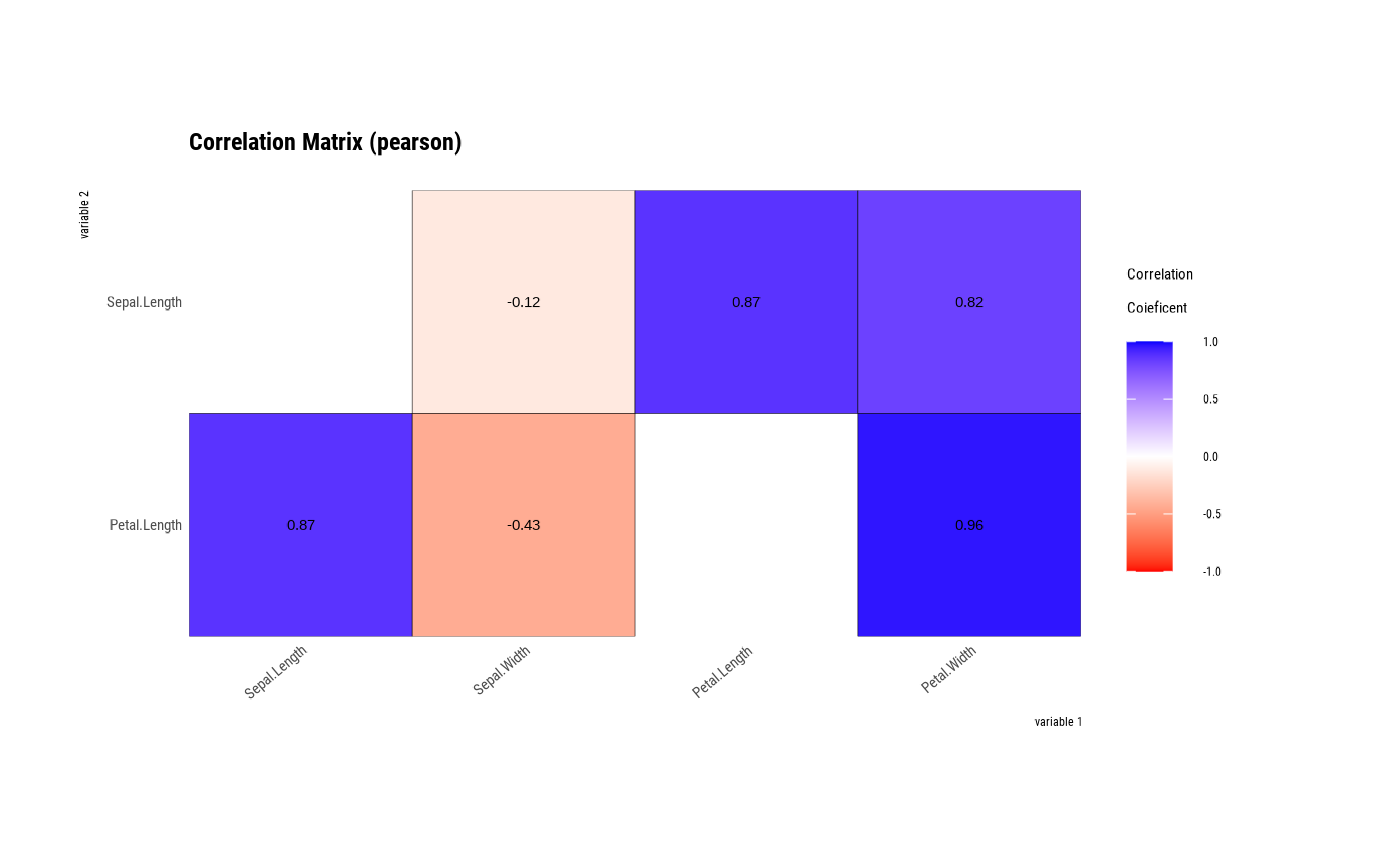
 tab_corr <- iris %>%
correlate(Sepal.Length, Petal.Length)
tab_corr
#> # A tibble: 6 × 3
#> var1 var2 coef_corr
#> <fct> <fct> <dbl>
#> 1 Petal.Length Sepal.Length 0.872
#> 2 Sepal.Length Sepal.Width -0.118
#> 3 Petal.Length Sepal.Width -0.428
#> 4 Sepal.Length Petal.Length 0.872
#> 5 Sepal.Length Petal.Width 0.818
#> 6 Petal.Length Petal.Width 0.963
# visualize correlate class
plot(tab_corr)
tab_corr <- iris %>%
correlate(Sepal.Length, Petal.Length)
tab_corr
#> # A tibble: 6 × 3
#> var1 var2 coef_corr
#> <fct> <fct> <dbl>
#> 1 Petal.Length Sepal.Length 0.872
#> 2 Sepal.Length Sepal.Width -0.118
#> 3 Petal.Length Sepal.Width -0.428
#> 4 Sepal.Length Petal.Length 0.872
#> 5 Sepal.Length Petal.Width 0.818
#> 6 Petal.Length Petal.Width 0.963
# visualize correlate class
plot(tab_corr)
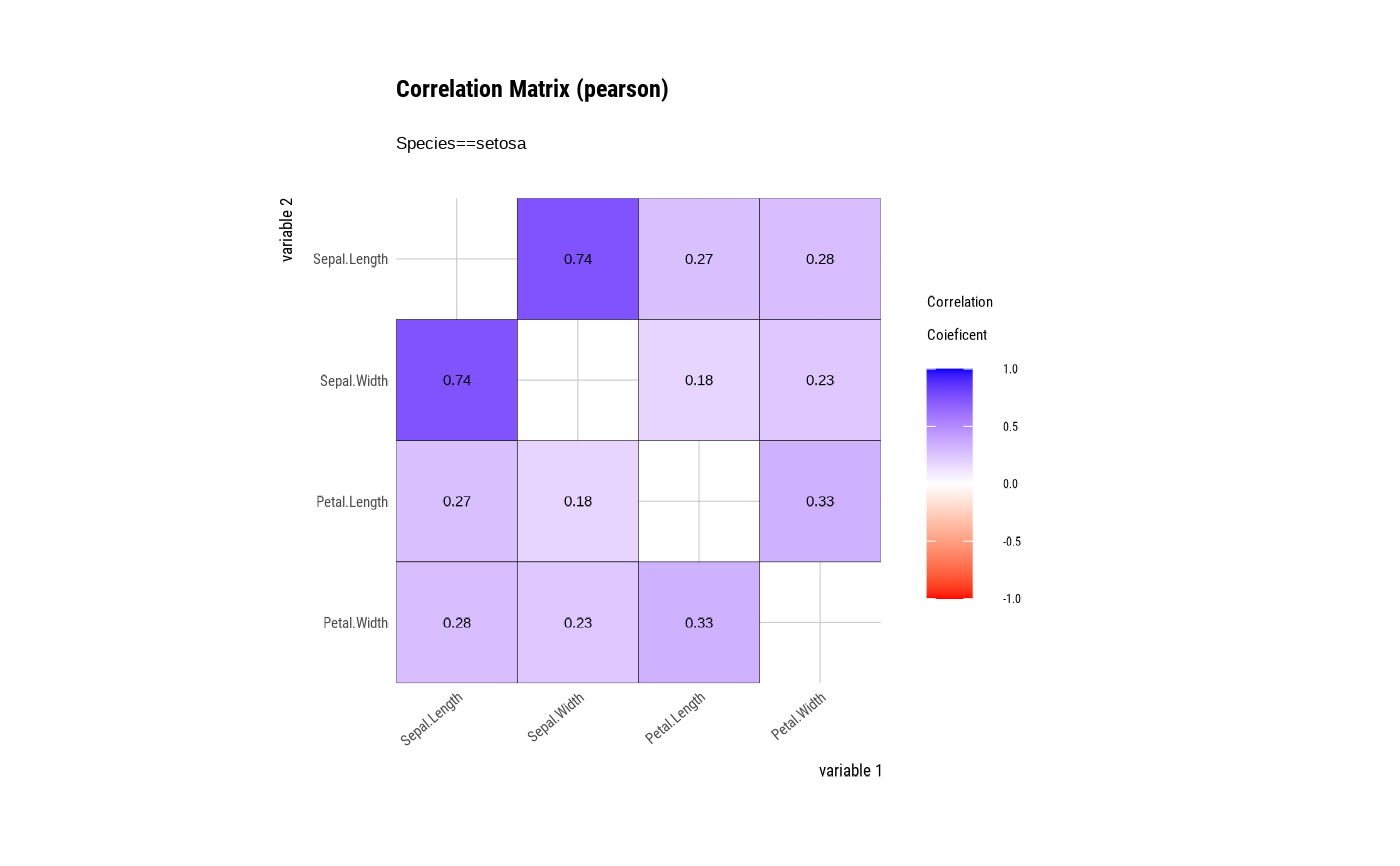
 # correlate type is group ====================================
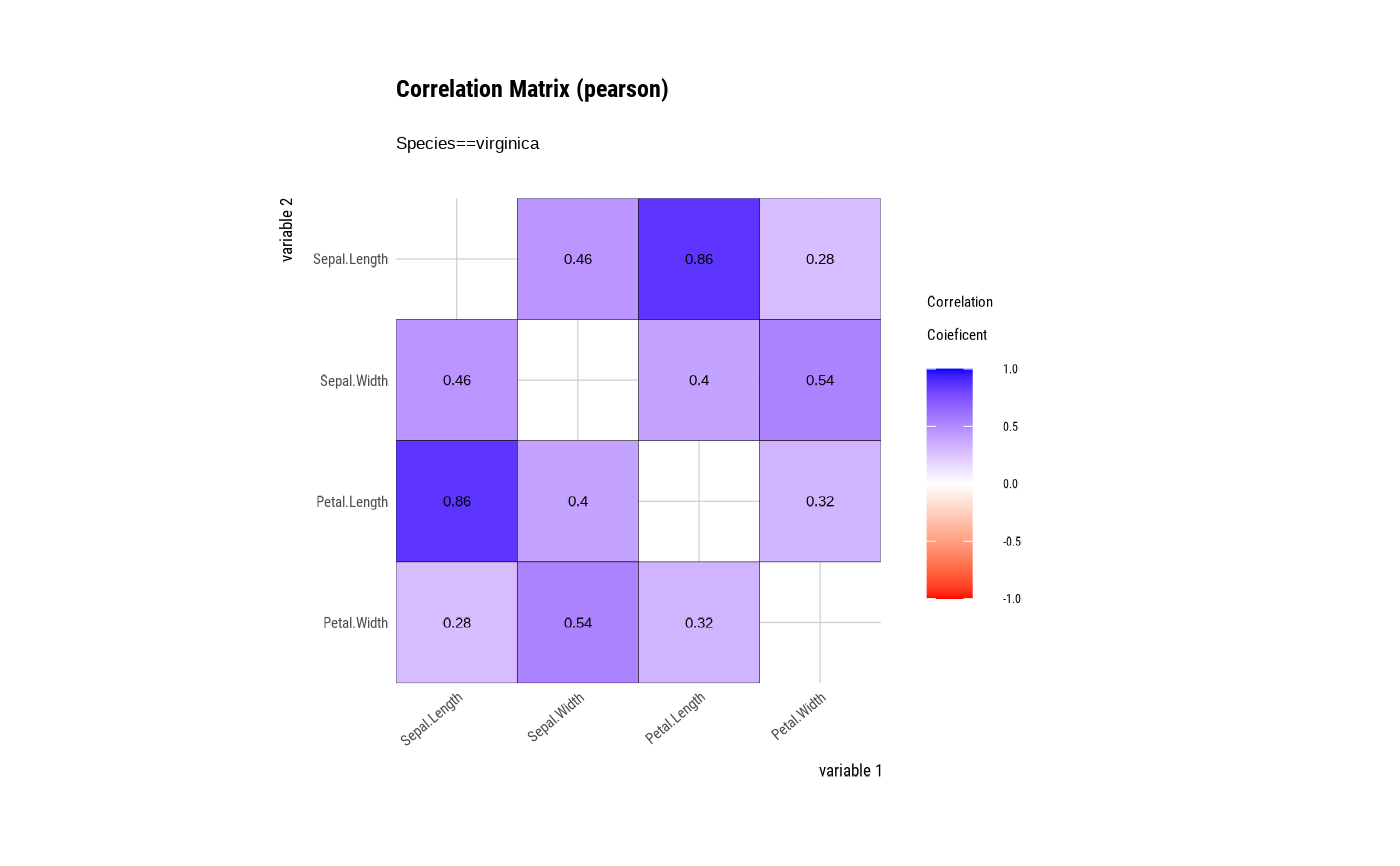
# Draw a correlation matrix plot by category of Species.
tab_corr <- iris %>%
group_by(Species) %>%
correlate()
# plot correlate class
plot(tab_corr)
#> Warning: font family 'Roboto Condensed Light' not found, will use 'sans' instead
#> Warning: font family 'Roboto Condensed Light' not found, will use 'sans' instead
#> Warning: font family 'Roboto Condensed Light' not found, will use 'sans' instead
#> Warning: font family 'Roboto Condensed Light' not found, will use 'sans' instead
#> Warning: font family 'Roboto Condensed Light' not found, will use 'sans' instead
#> Warning: font family 'Roboto Condensed Light' not found, will use 'sans' instead
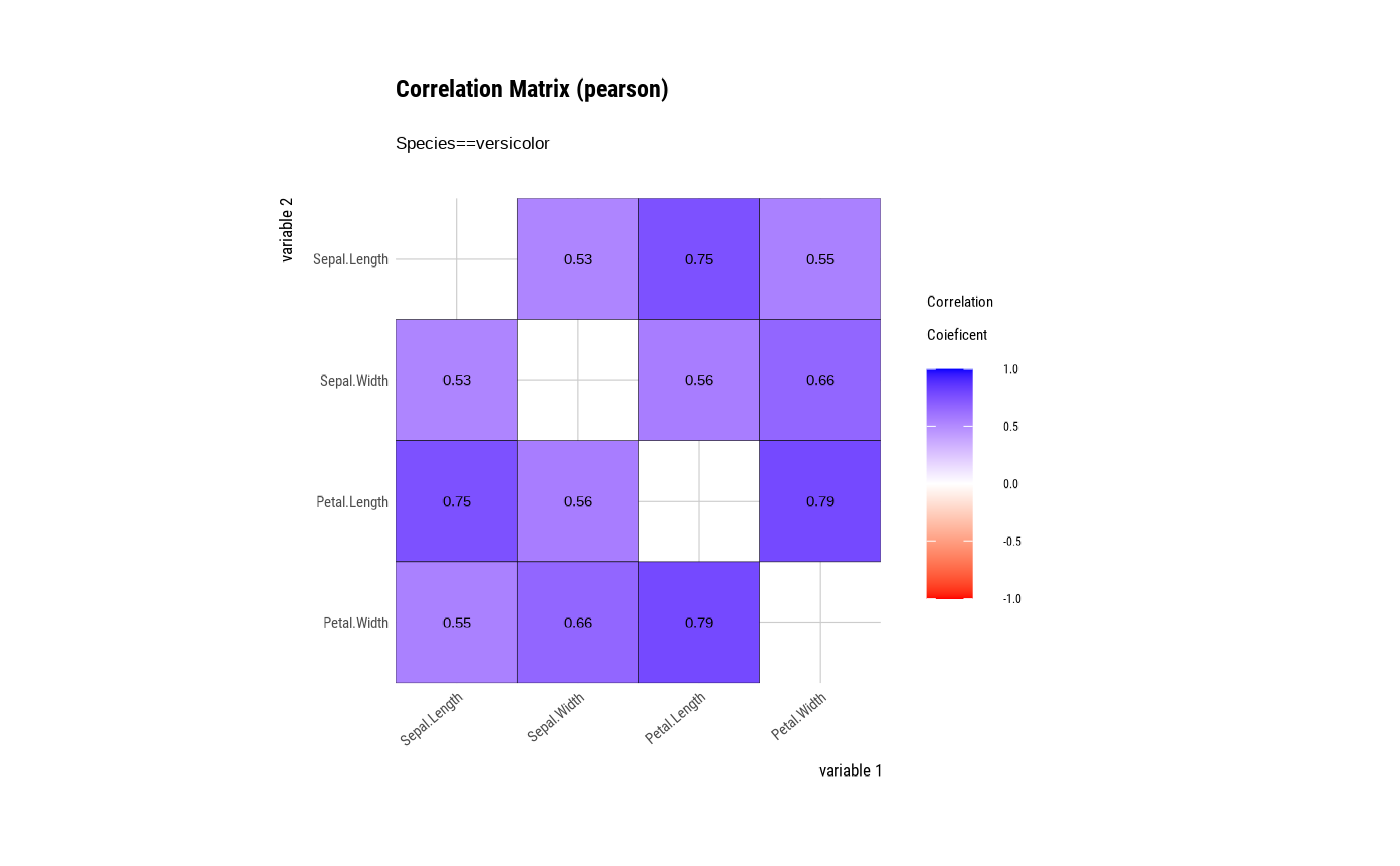
# correlate type is group ====================================
# Draw a correlation matrix plot by category of Species.
tab_corr <- iris %>%
group_by(Species) %>%
correlate()
# plot correlate class
plot(tab_corr)
#> Warning: font family 'Roboto Condensed Light' not found, will use 'sans' instead
#> Warning: font family 'Roboto Condensed Light' not found, will use 'sans' instead
#> Warning: font family 'Roboto Condensed Light' not found, will use 'sans' instead
#> Warning: font family 'Roboto Condensed Light' not found, will use 'sans' instead
#> Warning: font family 'Roboto Condensed Light' not found, will use 'sans' instead
#> Warning: font family 'Roboto Condensed Light' not found, will use 'sans' instead
 #> Warning: font family 'Roboto Condensed Light' not found, will use 'sans' instead
#> Warning: font family 'Roboto Condensed Light' not found, will use 'sans' instead
#> Warning: font family 'Roboto Condensed Light' not found, will use 'sans' instead
#> Warning: font family 'Roboto Condensed Light' not found, will use 'sans' instead
#> Warning: font family 'Roboto Condensed Light' not found, will use 'sans' instead
#> Warning: font family 'Roboto Condensed Light' not found, will use 'sans' instead
#> Warning: font family 'Roboto Condensed Light' not found, will use 'sans' instead
#> Warning: font family 'Roboto Condensed Light' not found, will use 'sans' instead
#> Warning: font family 'Roboto Condensed Light' not found, will use 'sans' instead
#> Warning: font family 'Roboto Condensed Light' not found, will use 'sans' instead
#> Warning: font family 'Roboto Condensed Light' not found, will use 'sans' instead
 ## S3 method for correlate class by 'tbl_dbi' ================
# If you have the 'DBI' and 'RSQLite' packages installed, perform the code block:
if (FALSE) {
# connect DBMS
con_sqlite <- DBI::dbConnect(RSQLite::SQLite(), ":memory:")
# copy iris to the DBMS with a table named TB_IRIS
copy_to(con_sqlite, iris, name = "TB_IRIS", overwrite = TRUE)
# correlation coefficients of all numerical variables
tab_corr <- con_sqlite %>%
tbl("TB_IRIS") %>%
correlate()
plot(tab_corr)
# Disconnect DBMS
DBI::dbDisconnect(con_sqlite)
}
# }
## S3 method for correlate class by 'tbl_dbi' ================
# If you have the 'DBI' and 'RSQLite' packages installed, perform the code block:
if (FALSE) {
# connect DBMS
con_sqlite <- DBI::dbConnect(RSQLite::SQLite(), ":memory:")
# copy iris to the DBMS with a table named TB_IRIS
copy_to(con_sqlite, iris, name = "TB_IRIS", overwrite = TRUE)
# correlation coefficients of all numerical variables
tab_corr <- con_sqlite %>%
tbl("TB_IRIS") %>%
correlate()
plot(tab_corr)
# Disconnect DBMS
DBI::dbDisconnect(con_sqlite)
}
# }