Visualize by attribute of `pps` class. The plot of a PPS(Predictive Power Score) is a bar plot or tile plot by PPS.
# S3 method for class 'pps'
plot(x, typographic = TRUE, base_family = NULL, ...)
Arguments
- x
an object of class "pps", usually, a result of a call to pps().
- typographic
logical. Whether to apply focuses on typographic elements to ggplot2 visualization. The default is TRUE. if TRUE provides a base theme that focuses on typographic elements.
- base_family
character. The name of the base font family to use for the visualization. If not specified, the font defined in dlookr is applied. (See details)
- ...
arguments to be passed to methods, such as graphical parameters (see par).
Value
A ggplot2 object.
Details
The base_family is selected from "Roboto Condensed", "Liberation Sans Narrow", "NanumSquare", "Noto Sans Korean". If you want to use a different font, use it after loading the Google font with import_google_font().
See also
Examples
library(dplyr)
# If you want to use this feature, you need to install the 'ppsr' package.
if (!requireNamespace("ppsr", quietly = TRUE)) {
cat("If you want to use this feature, you need to install the 'ppsr' package.\n")
}
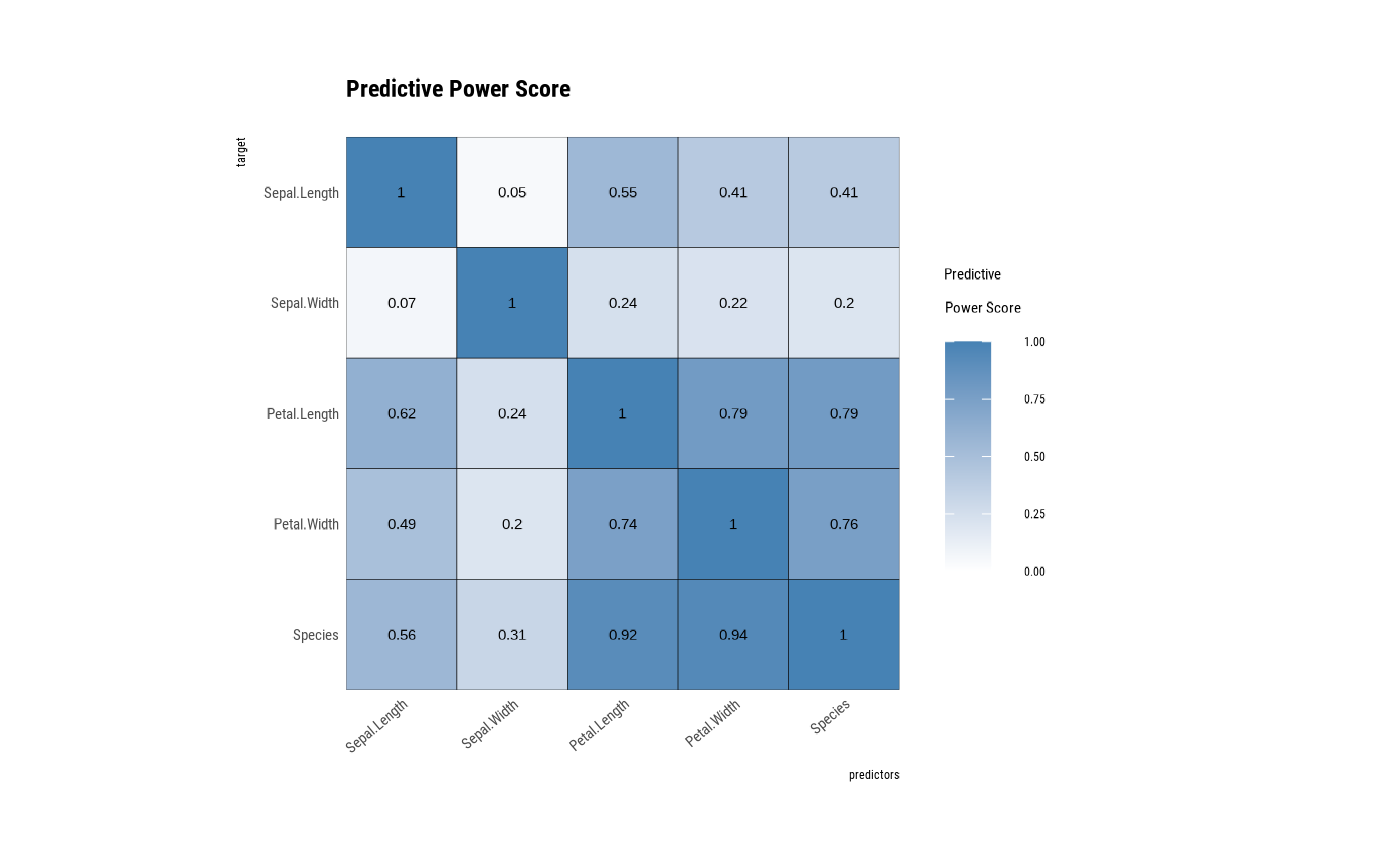
# pps type is generic ======================================
pps_generic <- pps(iris)
pps_generic
#> x y result_type pps
#> 1 Sepal.Length Sepal.Length predictor and target are the same 1.00000000
#> 2 Sepal.Width Sepal.Length predictive power score 0.04632352
#> 3 Petal.Length Sepal.Length predictive power score 0.54913985
#> 4 Petal.Width Sepal.Length predictive power score 0.41276679
#> 5 Species Sepal.Length predictive power score 0.40754872
#> 6 Sepal.Length Sepal.Width predictive power score 0.06790301
#> 7 Sepal.Width Sepal.Width predictor and target are the same 1.00000000
#> 8 Petal.Length Sepal.Width predictive power score 0.23769911
#> 9 Petal.Width Sepal.Width predictive power score 0.21746588
#> 10 Species Sepal.Width predictive power score 0.20128762
#> 11 Sepal.Length Petal.Length predictive power score 0.61608360
#> 12 Sepal.Width Petal.Length predictive power score 0.24263851
#> 13 Petal.Length Petal.Length predictor and target are the same 1.00000000
#> 14 Petal.Width Petal.Length predictive power score 0.79175121
#> 15 Species Petal.Length predictive power score 0.79049070
#> 16 Sepal.Length Petal.Width predictive power score 0.48735314
#> 17 Sepal.Width Petal.Width predictive power score 0.20124105
#> 18 Petal.Length Petal.Width predictive power score 0.74378445
#> 19 Petal.Width Petal.Width predictor and target are the same 1.00000000
#> 20 Species Petal.Width predictive power score 0.75611126
#> 21 Sepal.Length Species predictive power score 0.55918638
#> 22 Sepal.Width Species predictive power score 0.31344008
#> 23 Petal.Length Species predictive power score 0.91675800
#> 24 Petal.Width Species predictive power score 0.93985320
#> 25 Species Species predictor and target are the same 1.00000000
#> metric baseline_score model_score cv_folds seed algorithm
#> 1 <NA> NA NA NA NA <NA>
#> 2 MAE 0.6893222 0.6620058 5 1 tree
#> 3 MAE 0.6893222 0.3100867 5 1 tree
#> 4 MAE 0.6893222 0.4040123 5 1 tree
#> 5 MAE 0.6893222 0.4076661 5 1 tree
#> 6 MAE 0.3372222 0.3184796 5 1 tree
#> 7 <NA> NA NA NA NA <NA>
#> 8 MAE 0.3372222 0.2564258 5 1 tree
#> 9 MAE 0.3372222 0.2631636 5 1 tree
#> 10 MAE 0.3372222 0.2677963 5 1 tree
#> 11 MAE 1.5719667 0.5971445 5 1 tree
#> 12 MAE 1.5719667 1.1945031 5 1 tree
#> 13 <NA> NA NA NA NA <NA>
#> 14 MAE 1.5719667 0.3265152 5 1 tree
#> 15 MAE 1.5719667 0.3280552 5 1 tree
#> 16 MAE 0.6623556 0.3377682 5 1 tree
#> 17 MAE 0.6623556 0.5315834 5 1 tree
#> 18 MAE 0.6623556 0.1684906 5 1 tree
#> 19 <NA> NA NA NA NA <NA>
#> 20 MAE 0.6623556 0.1608119 5 1 tree
#> 21 F1_weighted 0.3176487 0.7028029 5 1 tree
#> 22 F1_weighted 0.3176487 0.5377587 5 1 tree
#> 23 F1_weighted 0.3176487 0.9404972 5 1 tree
#> 24 F1_weighted 0.3176487 0.9599148 5 1 tree
#> 25 <NA> NA NA NA NA <NA>
#> model_type
#> 1 <NA>
#> 2 regression
#> 3 regression
#> 4 regression
#> 5 regression
#> 6 regression
#> 7 <NA>
#> 8 regression
#> 9 regression
#> 10 regression
#> 11 regression
#> 12 regression
#> 13 <NA>
#> 14 regression
#> 15 regression
#> 16 regression
#> 17 regression
#> 18 regression
#> 19 <NA>
#> 20 regression
#> 21 classification
#> 22 classification
#> 23 classification
#> 24 classification
#> 25 <NA>
if (!is.null(pps_generic)) {
# visualize pps class
plot(pps_generic)
}
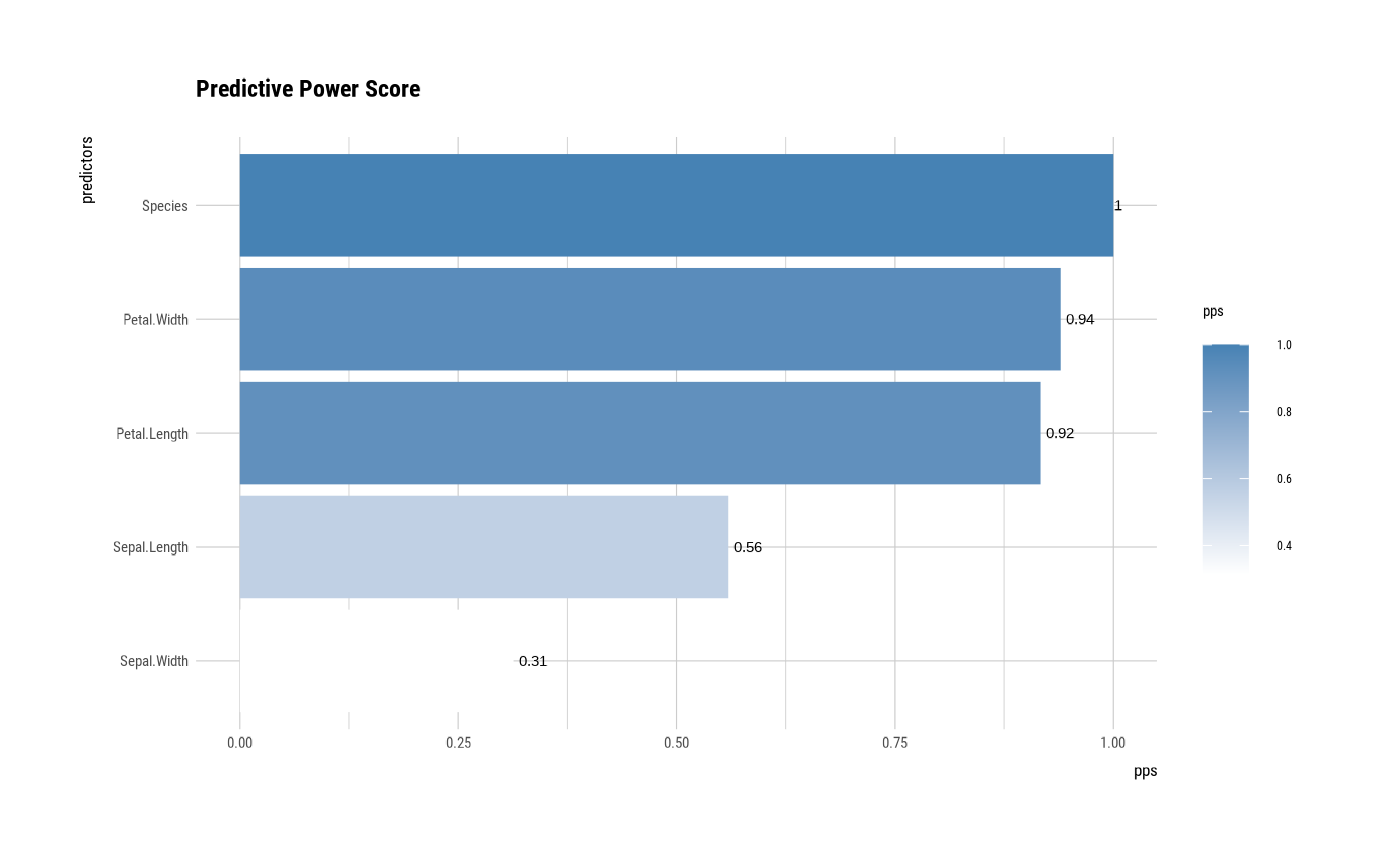
 # pps type is target_by =====================================
##-----------------------------------------------------------
# If the target variable is a categorical variable
# Using dplyr
pps_cat <- iris %>%
target_by(Species) %>%
pps()
if (!is.null(pps_cat)) {
# plot pps class
plot(pps_cat)
}
# pps type is target_by =====================================
##-----------------------------------------------------------
# If the target variable is a categorical variable
# Using dplyr
pps_cat <- iris %>%
target_by(Species) %>%
pps()
if (!is.null(pps_cat)) {
# plot pps class
plot(pps_cat)
}
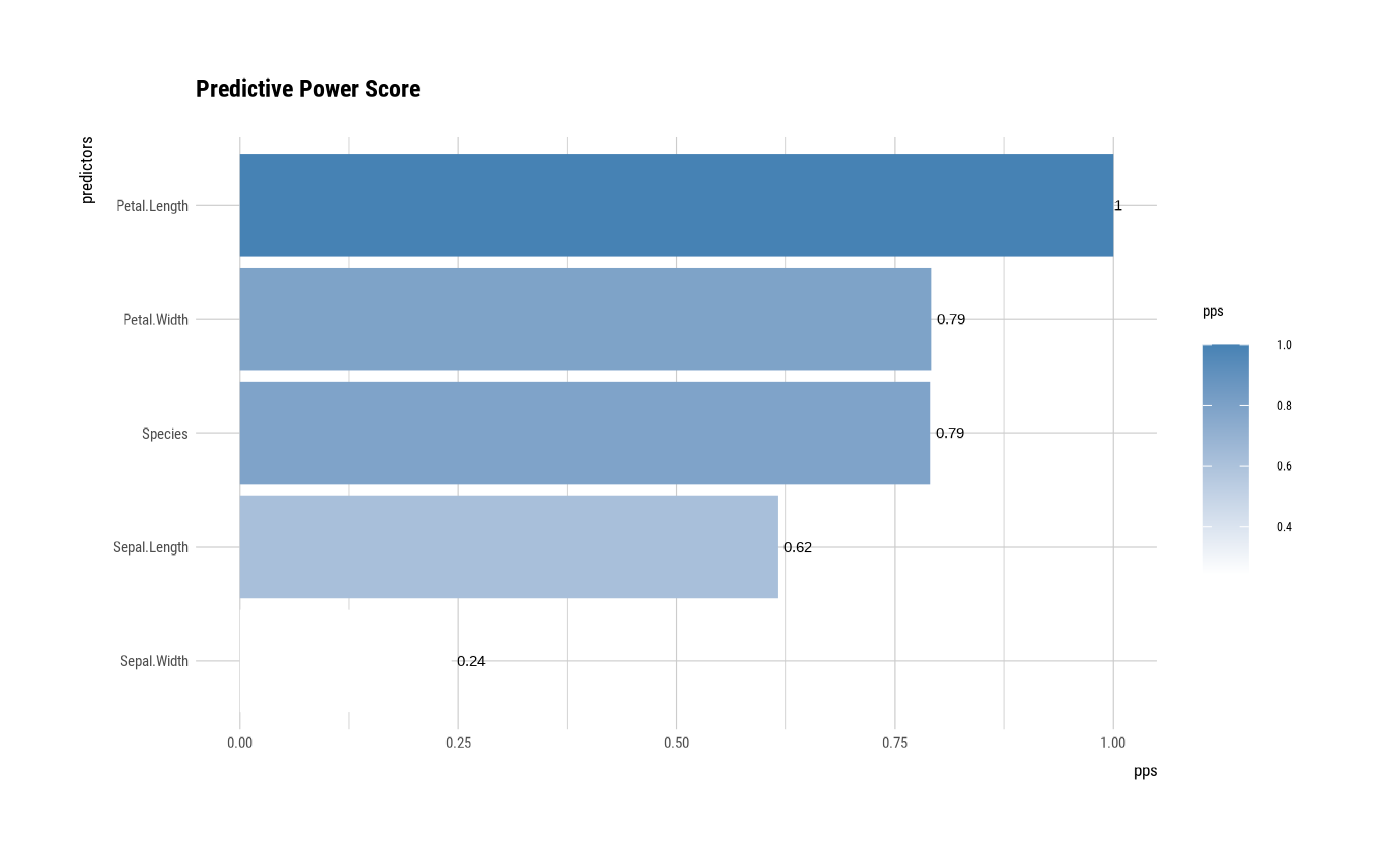
 ##---------------------------------------------------
# If the target variable is a numerical variable
# Using dplyr
pps_num <- iris %>%
target_by(Petal.Length) %>%
pps()
if (!is.null(pps_num)) {
# plot pps class
plot(pps_num)
}
##---------------------------------------------------
# If the target variable is a numerical variable
# Using dplyr
pps_num <- iris %>%
target_by(Petal.Length) %>%
pps()
if (!is.null(pps_num)) {
# plot pps class
plot(pps_num)
}