Plot the combination variables that is include missing value
Source:R/missing.R
plot_na_intersect.RdVisualize the combinations of missing value across cases.
plot_na_intersect(
  x,
  only_na = TRUE,
  n_intersacts = NULL,
  n_vars = NULL,
  main = NULL,
  typographic = TRUE,
  base_family = NULL
)
Arguments
- x
data frames, or objects to be coerced to one.
- only_na
logical. The default value is FALSE. If TRUE, only variables containing missing values are selected for visualization. If FALSE, included complete case.
- n_intersacts
integer. Specifies the number of combinations of variables including missing values. The combination of variables containing many missing values is chosen first.
- n_vars
integer. Specifies the number of variables that contain missing values to be visualized. The default value is NULL, which visualizes variables containing all missing values. If this value is greater than the number of variables containing missing values, all variables containing missing values are visualized. Variables containing many missing values are chosen first.
- main
character. Main title.
- typographic
logical. Whether to apply focuses on typographic elements to ggplot2 visualization. The default is TRUE. if TRUE provides a base theme that focuses on typographic elements.
- base_family
character. The name of the base font family to use for the visualization. If not specified, the font defined in dlookr is applied. (See details)
Value
an object of gtable class.
Details
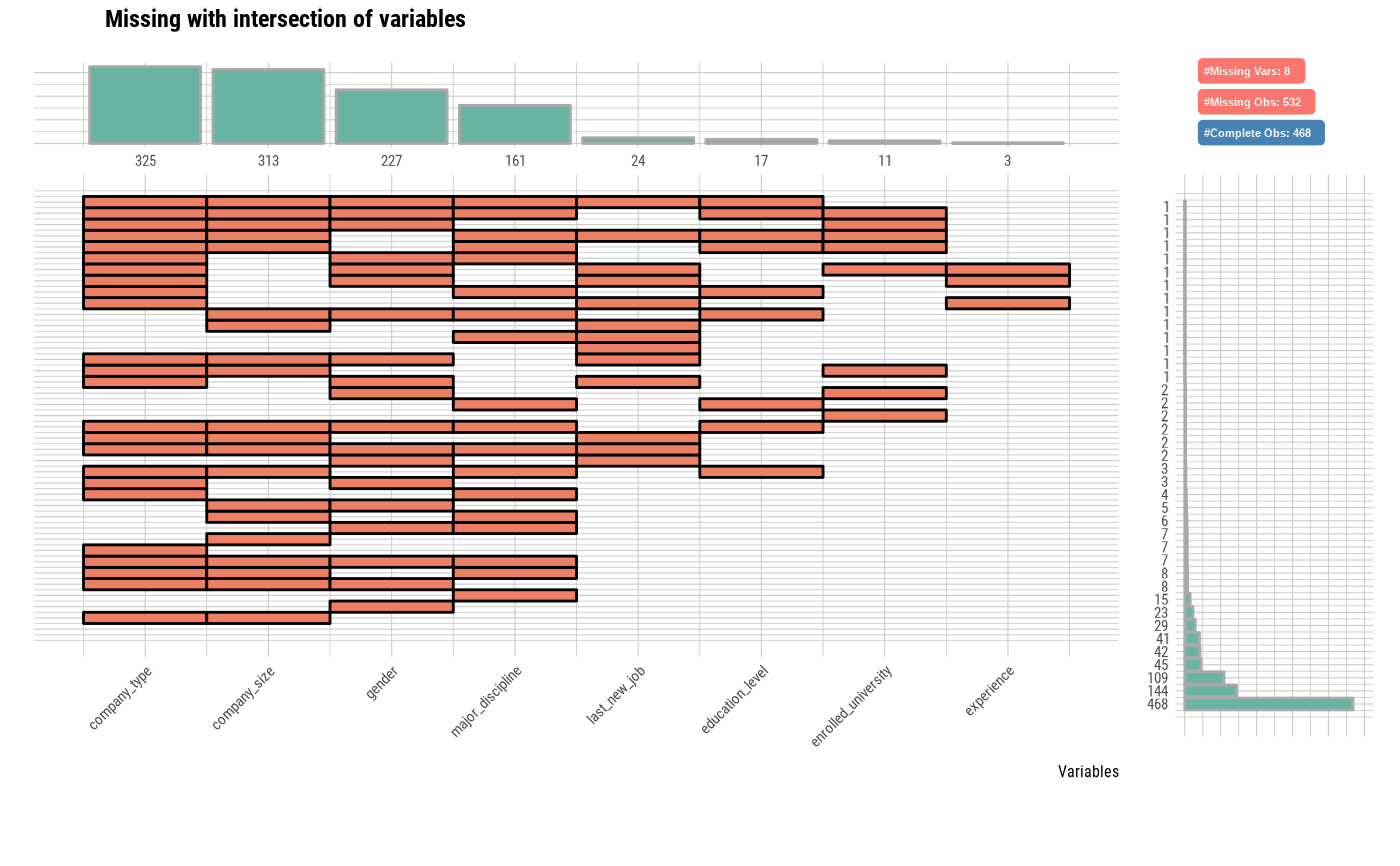
The visualization consists of four parts. The bottom left, which is the most basic, visualizes the case of cross(intersection)-combination. The x-axis is the variable including the missing value, and the y-axis represents the case of a combination of variables. And on the marginal of the two axes, the frequency of the case is expressed as a bar graph. Finally, the visualization at the top right expresses the number of variables including missing values in the data set, and the number of observations including missing values and complete cases .
The base_family is selected from "Roboto Condensed", "Liberation Sans Narrow", "NanumSquare", "Noto Sans Korean". If you want to use a different font, use it after loading the Google font with import_google_font().
Examples
# \donttest{
# Generate data for the example
set.seed(123L)
jobchange2 <- jobchange[sample(nrow(jobchange), size = 1000), ]
# Visualize the combination variables that is include missing value.
plot_na_intersect(jobchange2)
 # Diagnose the data with missing_count using diagnose() function
library(dplyr)
jobchange2 %>%
diagnose %>%
arrange(desc(missing_count))
#> # A tibble: 14 × 6
#> variables types missing_count missing_percent unique_count unique_rate
#> <chr> <chr> <int> <dbl> <int> <dbl>
#> 1 company_type fact… 325 32.5 7 0.007
#> 2 company_size orde… 313 31.3 9 0.009
#> 3 gender fact… 227 22.7 4 0.004
#> 4 major_discipline fact… 161 16.1 7 0.007
#> 5 last_new_job orde… 24 2.4 7 0.007
#> 6 education_level orde… 17 1.7 6 0.006
#> 7 enrolled_univer… fact… 11 1.1 4 0.004
#> 8 experience orde… 3 0.3 23 0.023
#> 9 enrollee_id char… 0 0 1000 1
#> 10 city fact… 0 0 88 0.088
#> 11 city_dev_index nume… 0 0 72 0.072
#> 12 relevent_experi… fact… 0 0 2 0.002
#> 13 training_hours inte… 0 0 194 0.194
#> 14 job_chnge fact… 0 0 2 0.002
# Visualize the combination variables that is include missing value
plot_na_intersect(jobchange2)
# Diagnose the data with missing_count using diagnose() function
library(dplyr)
jobchange2 %>%
diagnose %>%
arrange(desc(missing_count))
#> # A tibble: 14 × 6
#> variables types missing_count missing_percent unique_count unique_rate
#> <chr> <chr> <int> <dbl> <int> <dbl>
#> 1 company_type fact… 325 32.5 7 0.007
#> 2 company_size orde… 313 31.3 9 0.009
#> 3 gender fact… 227 22.7 4 0.004
#> 4 major_discipline fact… 161 16.1 7 0.007
#> 5 last_new_job orde… 24 2.4 7 0.007
#> 6 education_level orde… 17 1.7 6 0.006
#> 7 enrolled_univer… fact… 11 1.1 4 0.004
#> 8 experience orde… 3 0.3 23 0.023
#> 9 enrollee_id char… 0 0 1000 1
#> 10 city fact… 0 0 88 0.088
#> 11 city_dev_index nume… 0 0 72 0.072
#> 12 relevent_experi… fact… 0 0 2 0.002
#> 13 training_hours inte… 0 0 194 0.194
#> 14 job_chnge fact… 0 0 2 0.002
# Visualize the combination variables that is include missing value
plot_na_intersect(jobchange2)
 # Visualize variables containing missing values and complete case
plot_na_intersect(jobchange2, only_na = FALSE)
# Visualize variables containing missing values and complete case
plot_na_intersect(jobchange2, only_na = FALSE)
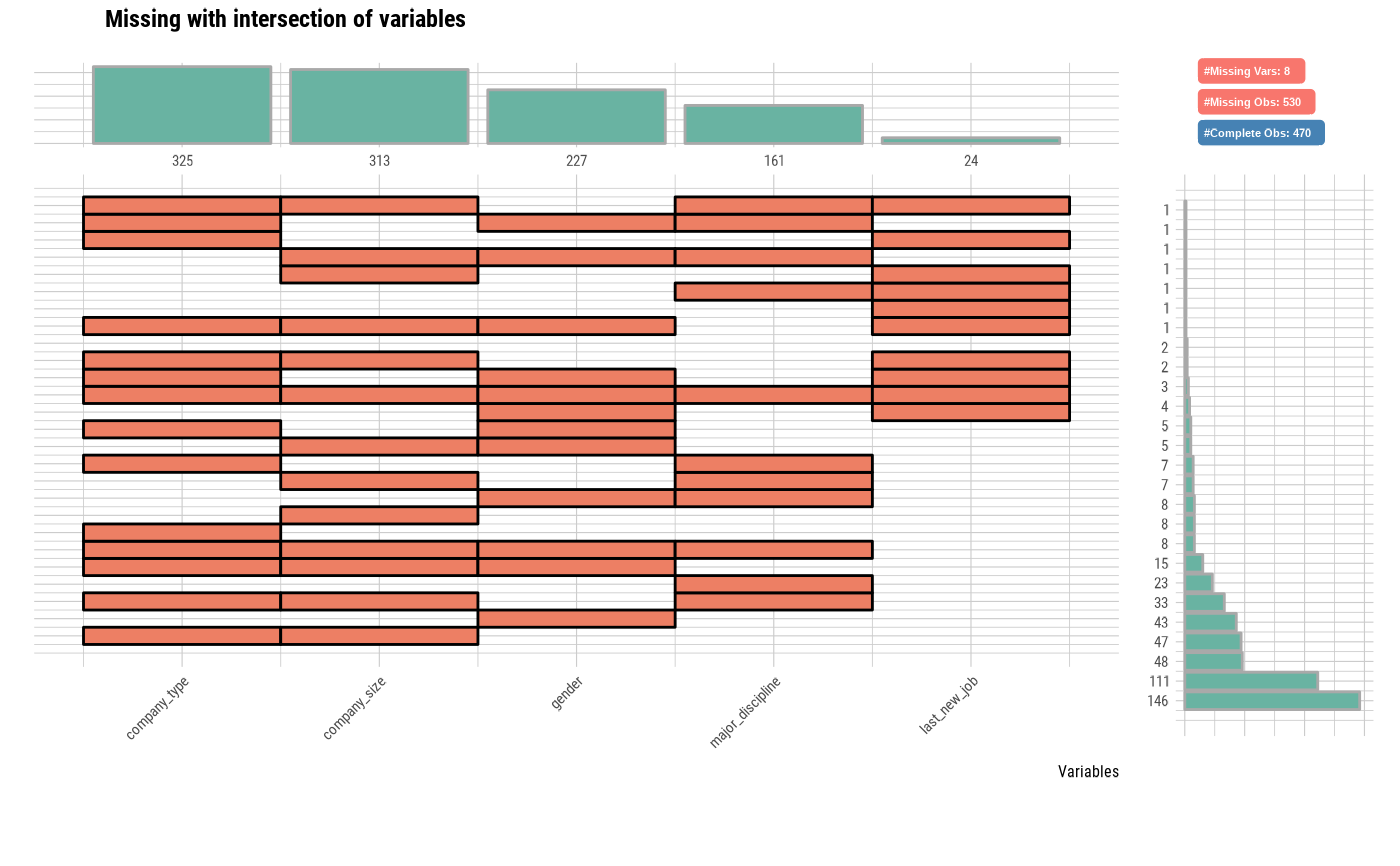
 # Using n_vars argument
plot_na_intersect(jobchange2, n_vars = 5)
# Using n_vars argument
plot_na_intersect(jobchange2, n_vars = 5)
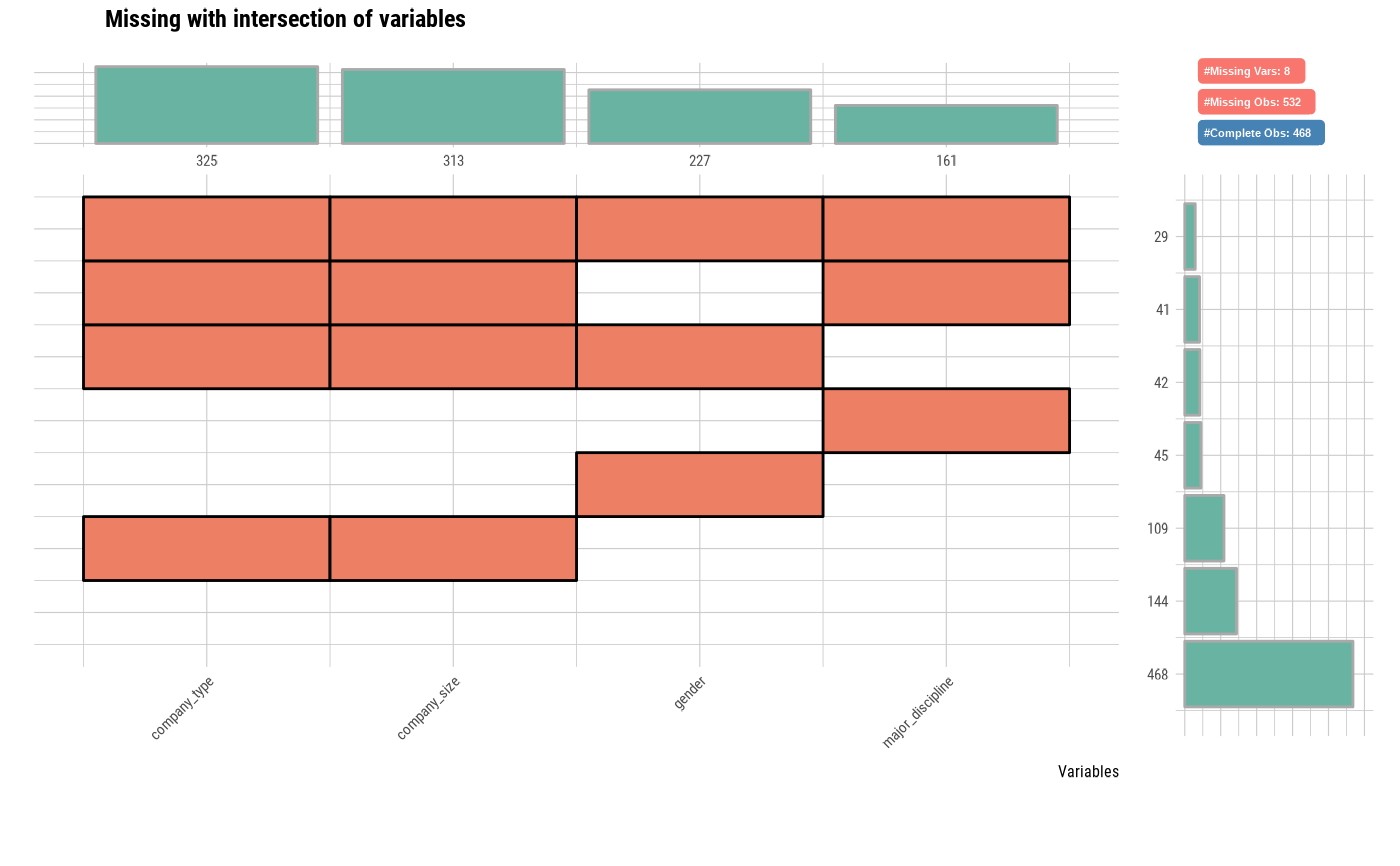
 # Using n_intersects argument
plot_na_intersect(jobchange2, only_na = FALSE, n_intersacts = 7)
# Using n_intersects argument
plot_na_intersect(jobchange2, only_na = FALSE, n_intersacts = 7)
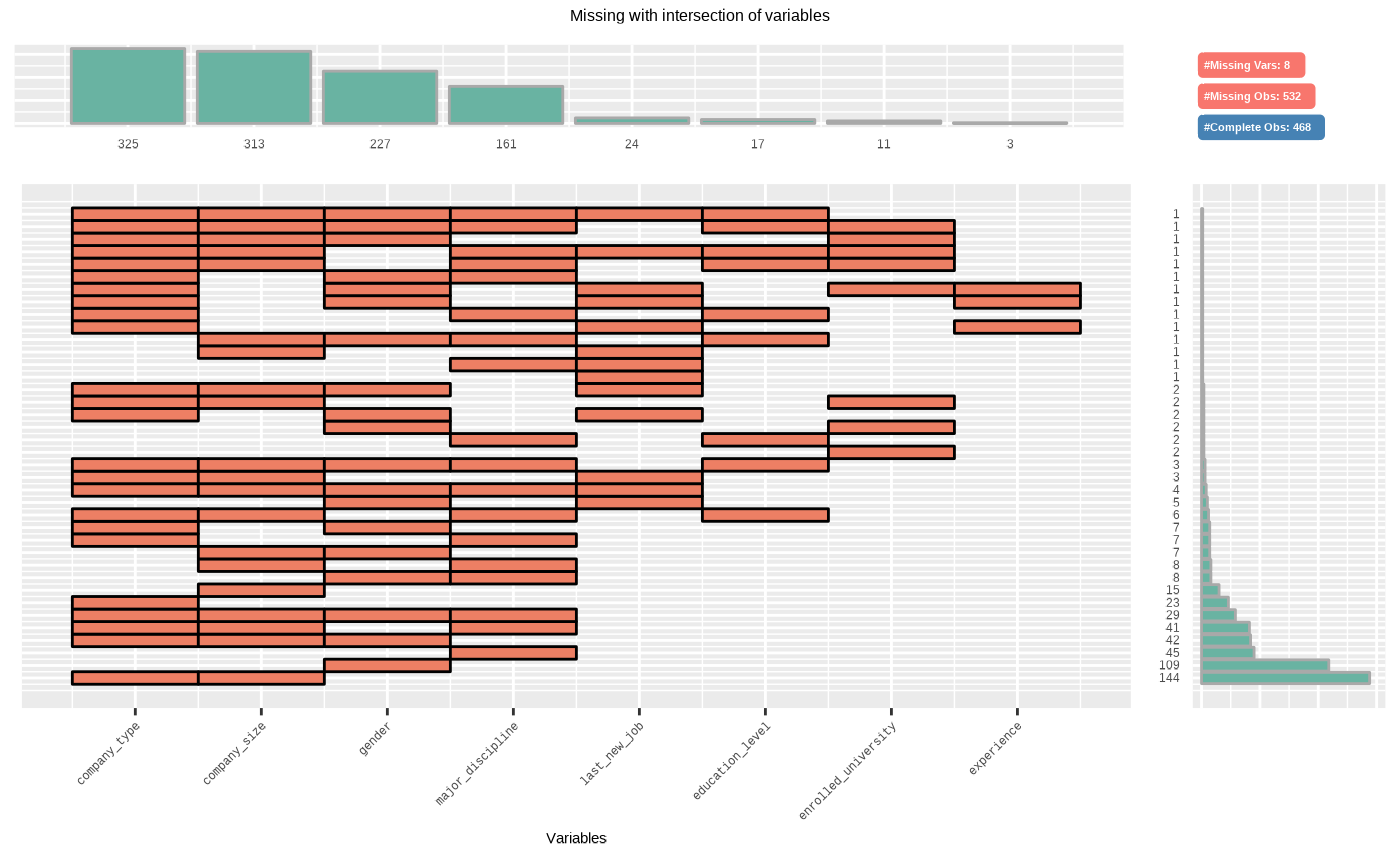
 # Non typographic elements
plot_na_intersect(jobchange2, typographic = FALSE)
# Non typographic elements
plot_na_intersect(jobchange2, typographic = FALSE)
 # }
# }