The plot_qq_numeric() to visualizes the Q-Q plot of numeric data or relationship to specific categorical data.
plot_qq_numeric(.data, ...)

# S3 method for class 'data.frame'
plot_qq_numeric(
  .data,
  ...,
  col_point = "steelblue",
  col_line = "black",
  title = "Q-Q plot by numerical variables",
  each = FALSE,
  typographic = TRUE,
  base_family = NULL
)

# S3 method for class 'grouped_df'
plot_qq_numeric(
  .data,
  ...,
  col_point = "steelblue",
  col_line = "black",
  title = "Q-Q plot by numerical variables",
  each = FALSE,
  typographic = TRUE,
  base_family = NULL
)
Arguments
- .data
data.frame or a
tbl_dfor agrouped_df.- ...
one or more unquoted expressions separated by commas. You can treat variable names like they are positions. Positive values select variables; negative values to drop variables. If the first expression is negative, plot_qq_numeric() will automatically start with all variables. These arguments are automatically quoted and evaluated in a context where column names represent column positions. They support unquoting and splicing.
- col_point
character. a color of points in Q-Q plot.
- col_line
character. a color of line in Q-Q plot.
- title
character. a main title for the plot.
- each
logical. Specifies whether to draw multiple plots on one screen. The default is FALSE, which draws multiple plots on one screen.
- typographic
logical. Whether to apply focuses on typographic elements to ggplot2 visualization. The default is TRUE. if TRUE provides a base theme that focuses on typographic elements.
- base_family
character. The name of the base font family to use for the visualization. If not specified, the font defined in dlookr is applied. (See details)
Details
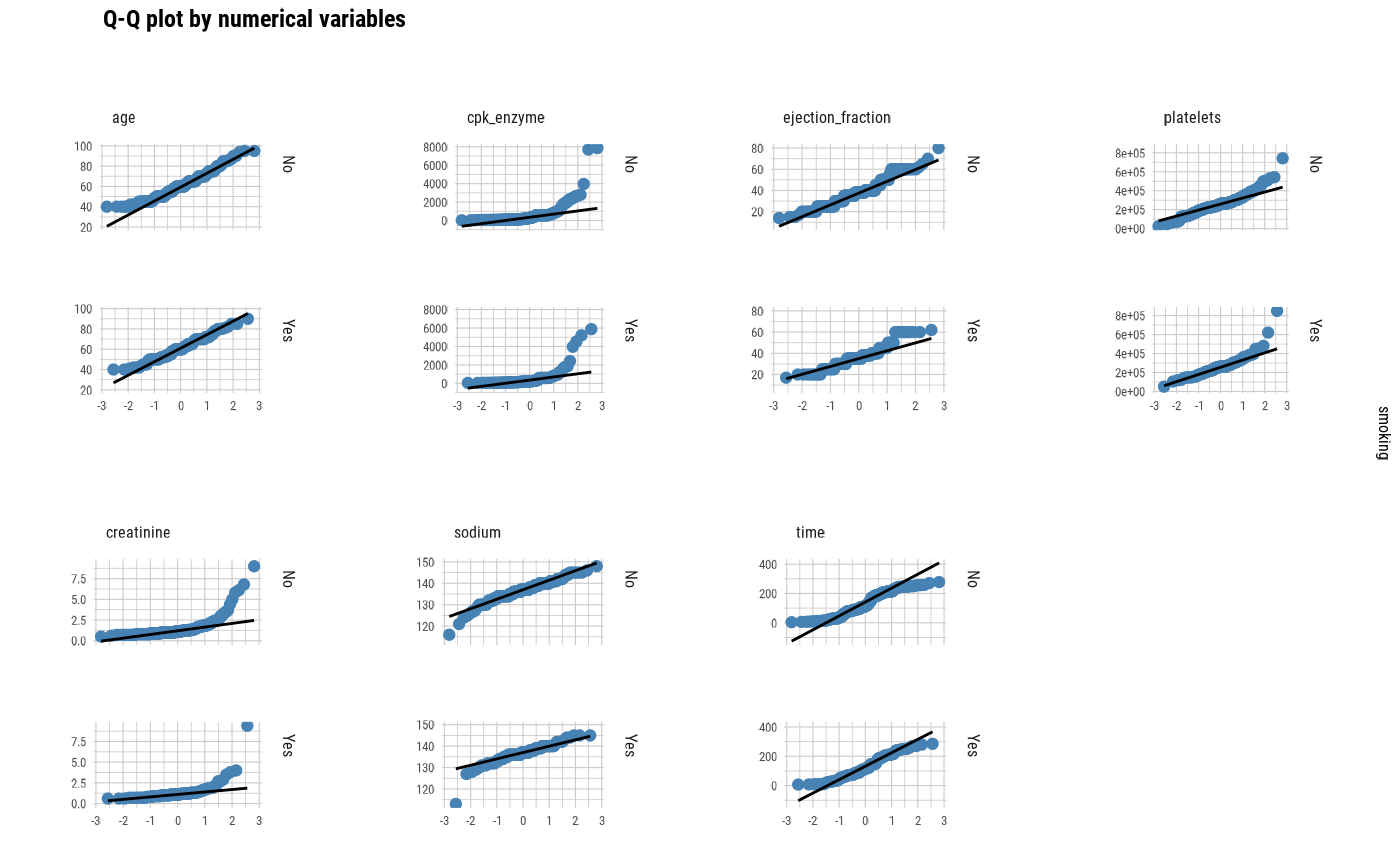
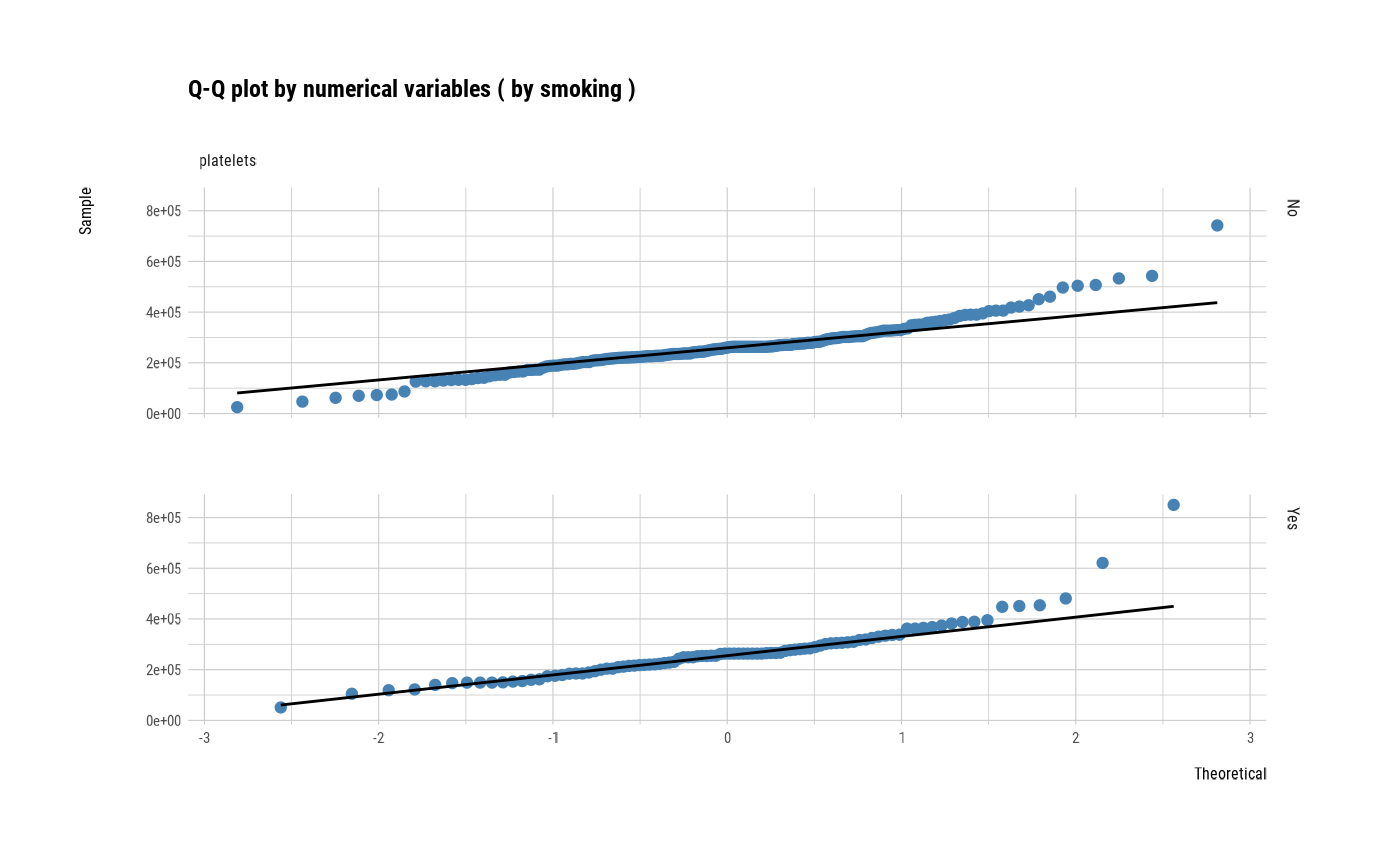
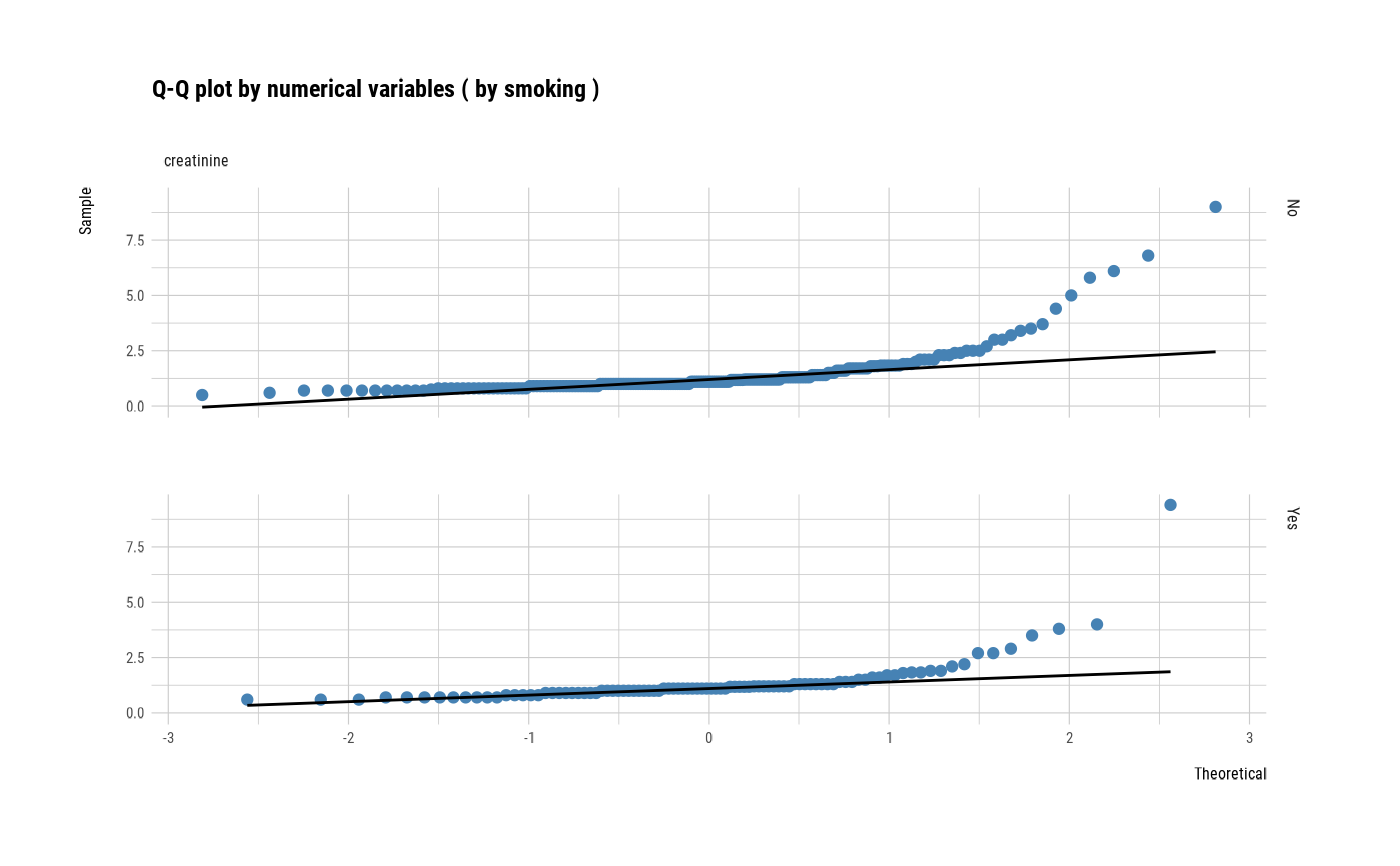
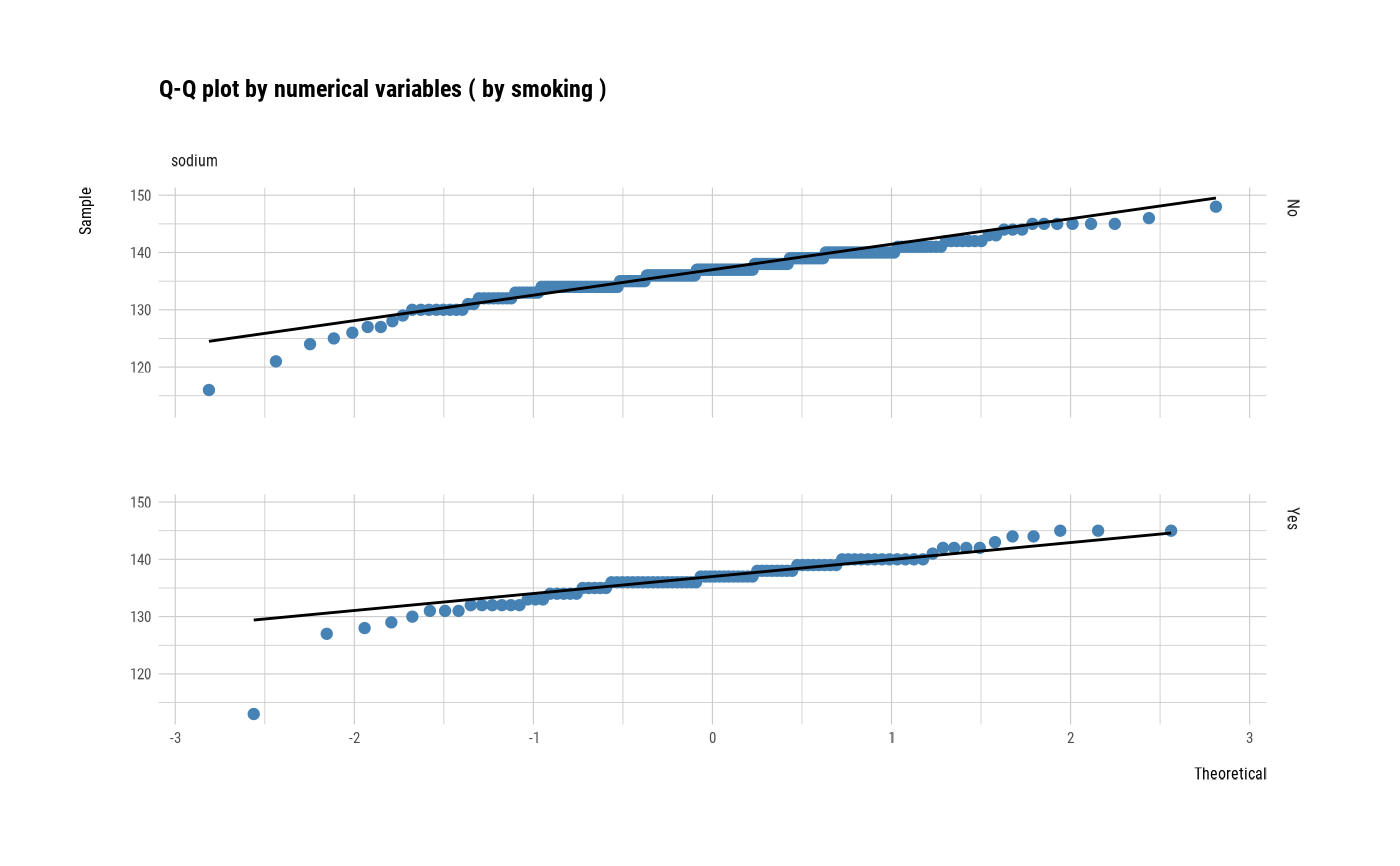
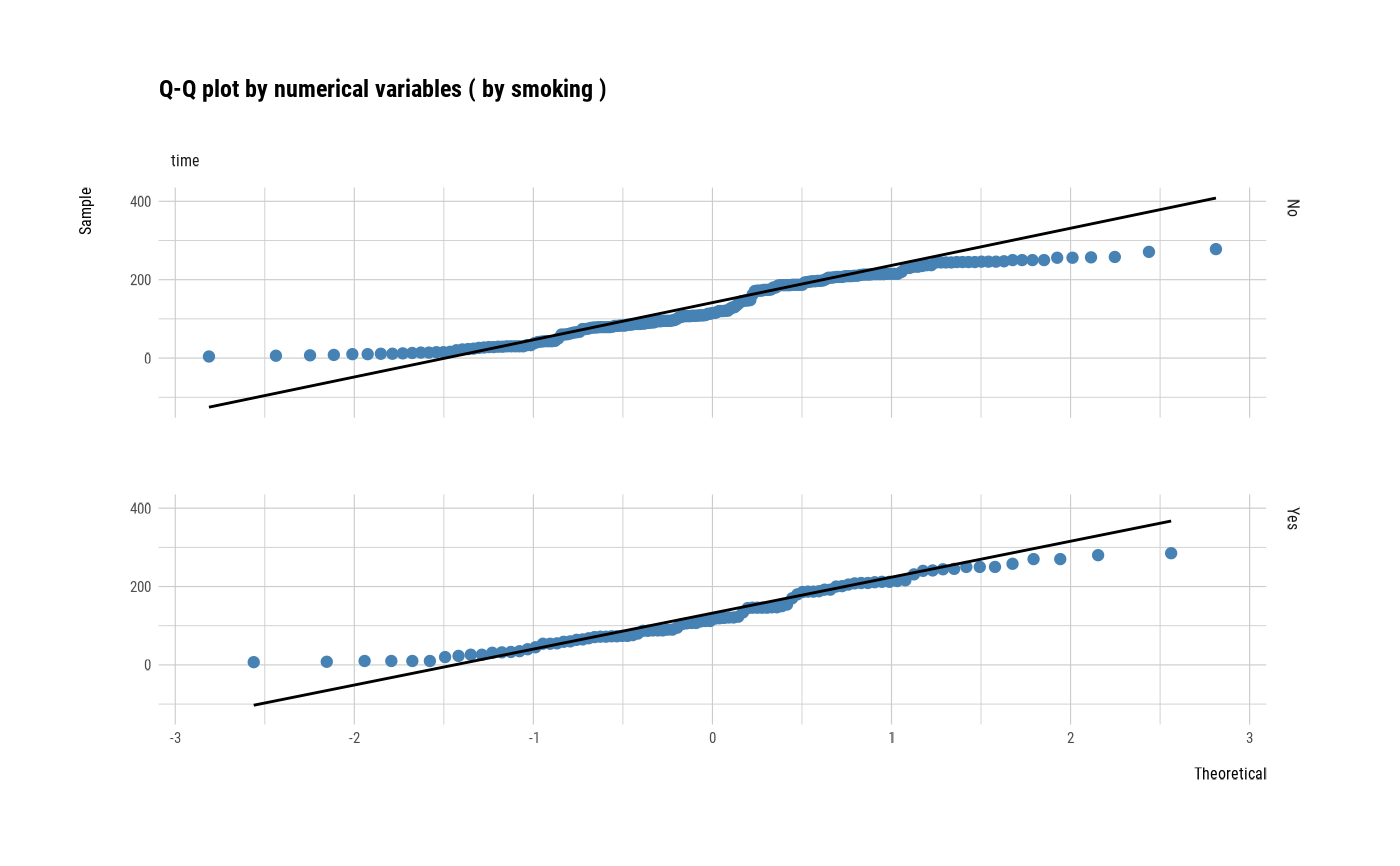
The The Q-Q plot helps determine whether the distribution of a numeric variable is normally distributed. plot_qq_numeric() shows Q-Q plots of several numeric variables on one screen. This function can also display a Q-Q plot for each level of a specific categorical variable.
The base_family is selected from "Roboto Condensed", "Liberation Sans Narrow", "NanumSquare", "Noto Sans Korean". If you want to use a different font, use it after loading the Google font with import_google_font().
Examples
# \donttest{
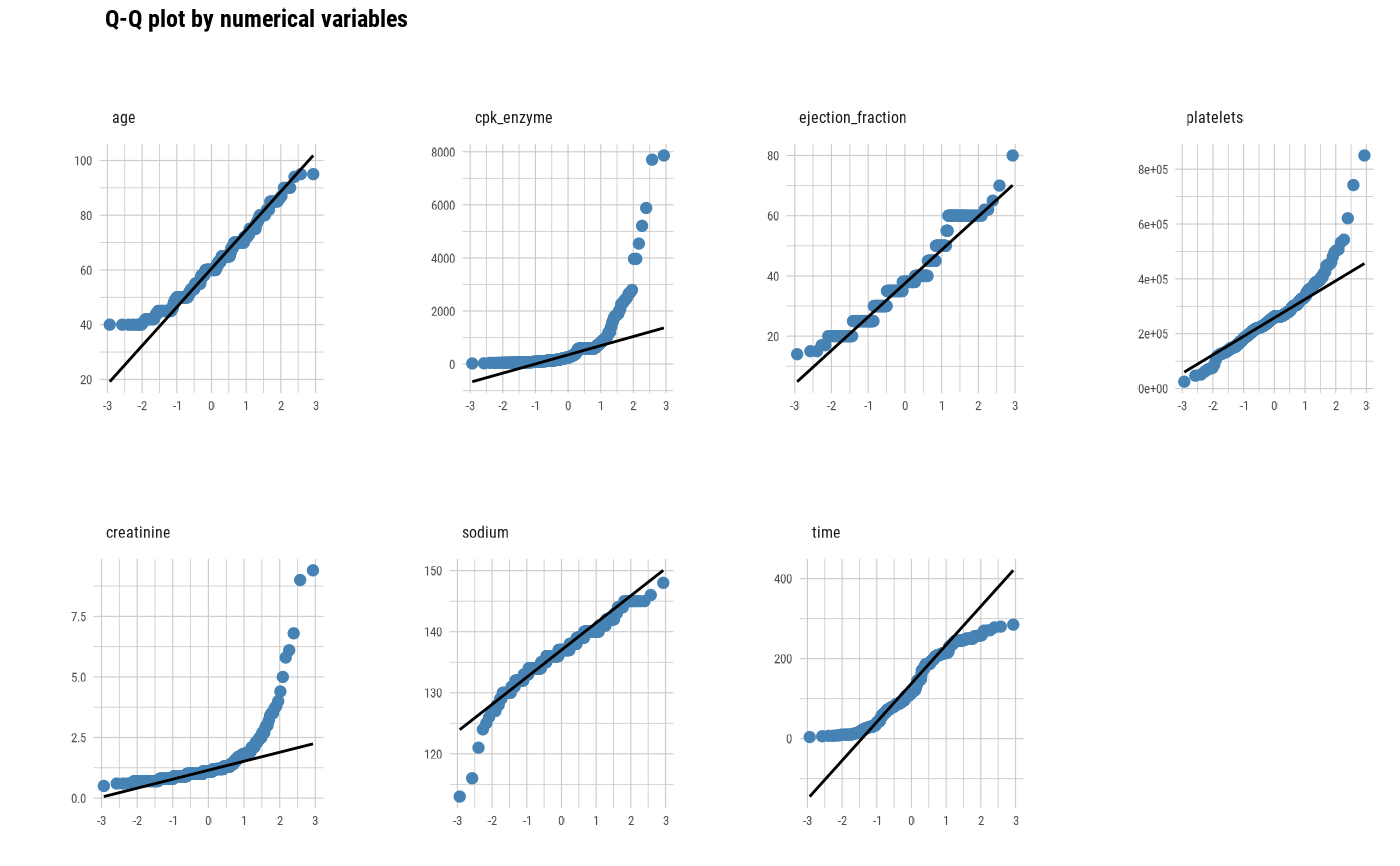
# Visualization of all numerical variables
plot_qq_numeric(heartfailure)
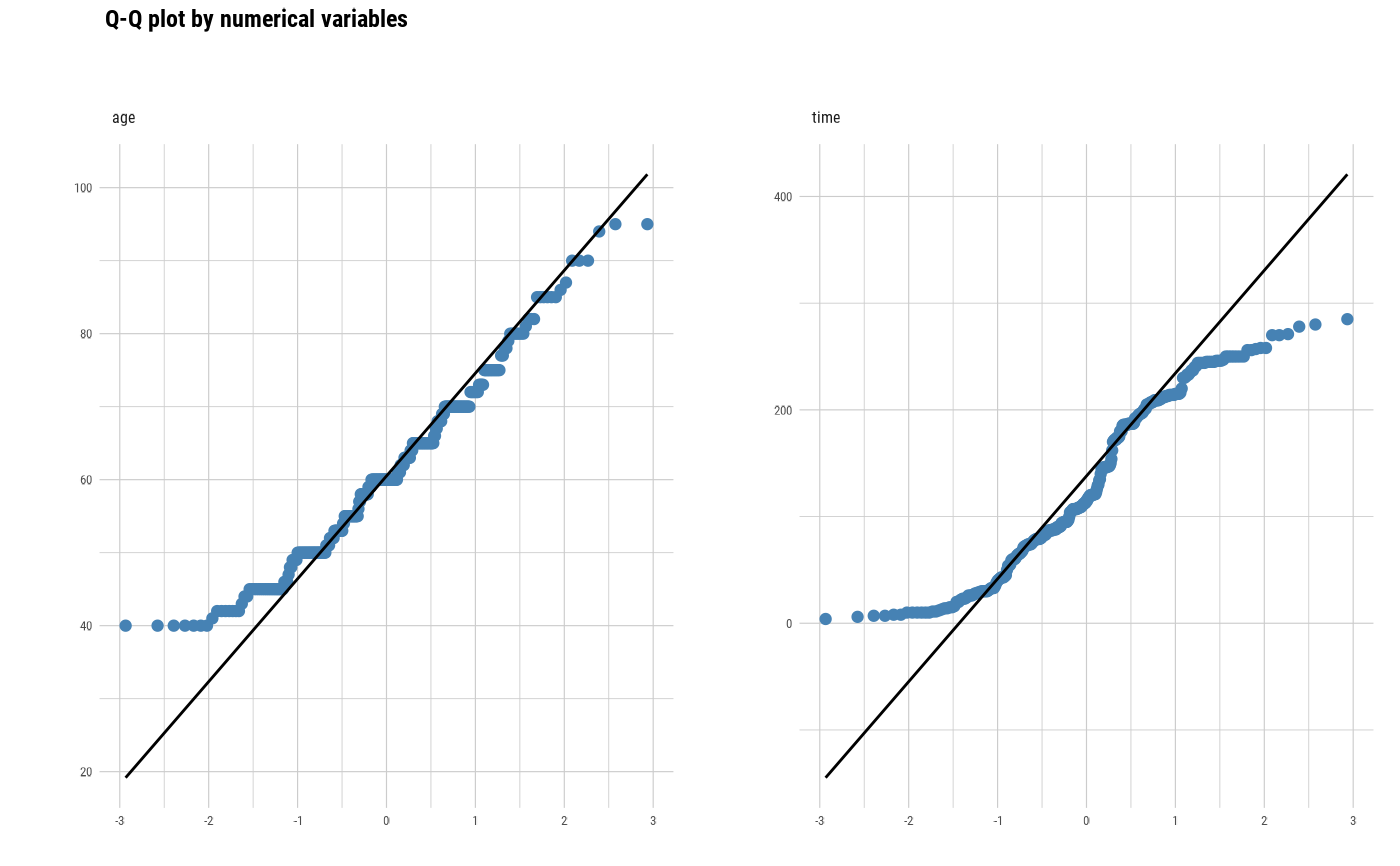
 # Select the variable to diagnose
plot_qq_numeric(heartfailure, "age", "time")
# Select the variable to diagnose
plot_qq_numeric(heartfailure, "age", "time")
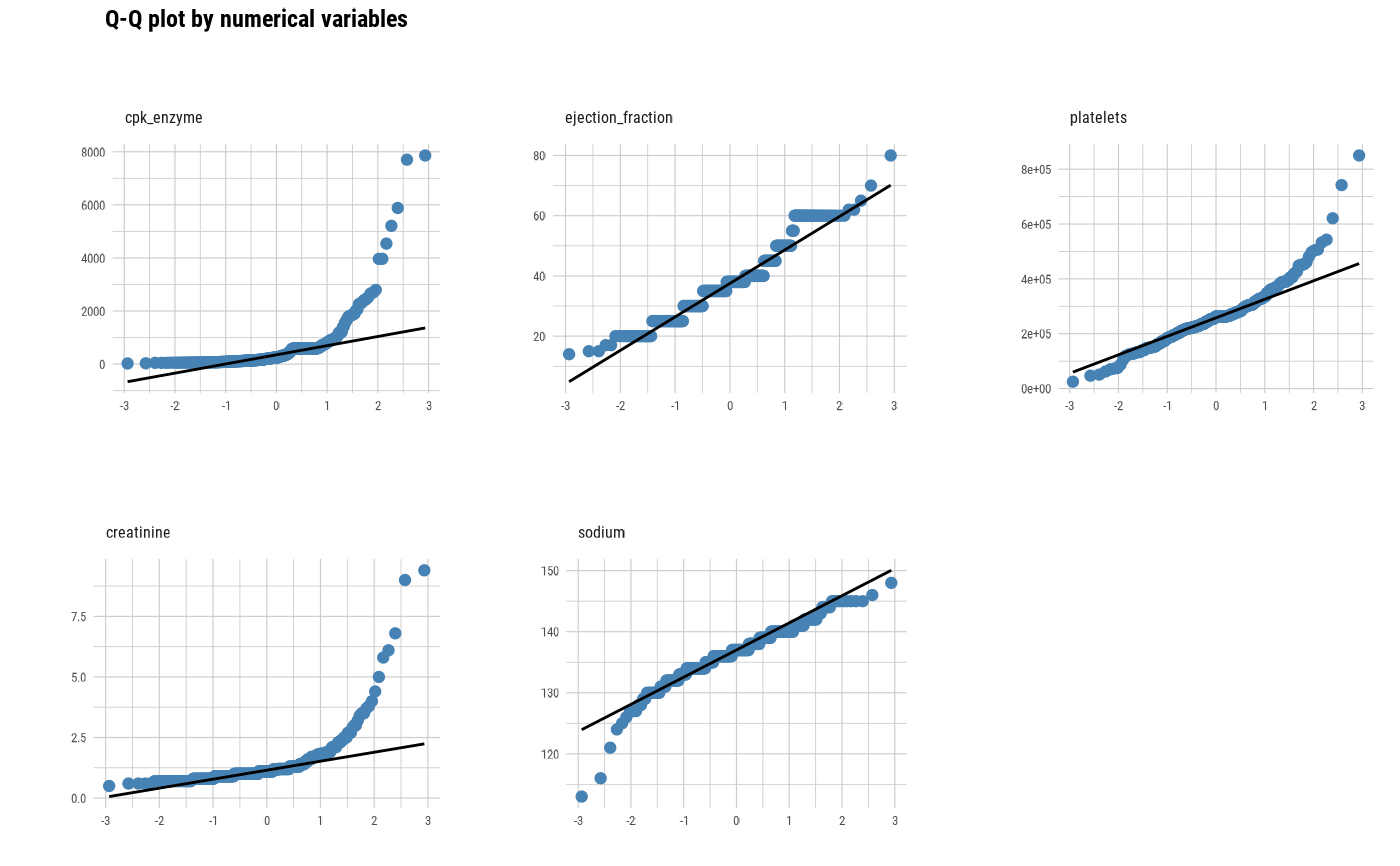
 plot_qq_numeric(heartfailure, -age, -time)
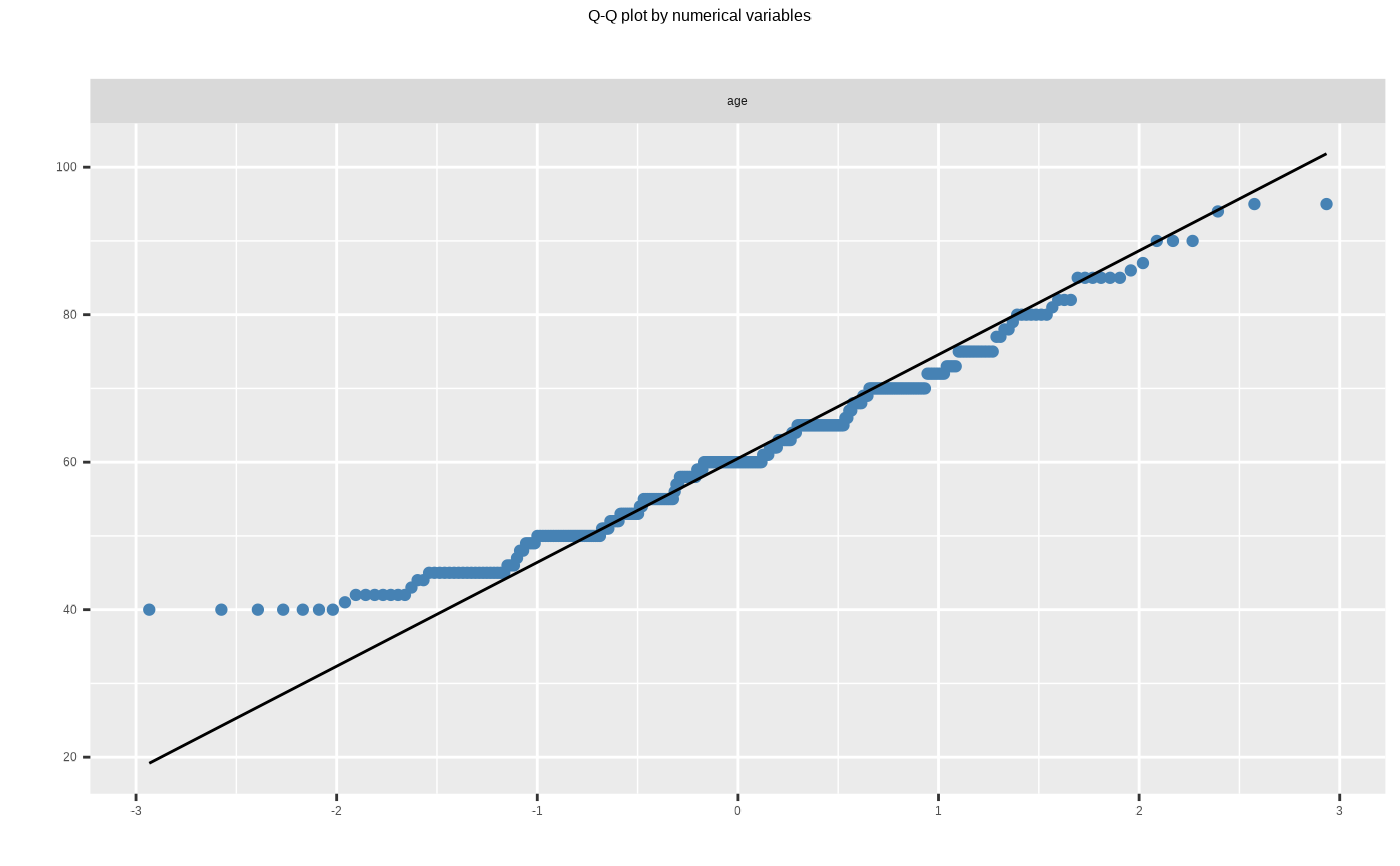
 # Not allow the typographic elements
plot_qq_numeric(heartfailure, "age", typographic = FALSE)
# Not allow the typographic elements
plot_qq_numeric(heartfailure, "age", typographic = FALSE)
 # Using pipes ---------------------------------
library(dplyr)
# Plot of all numerical variables
heartfailure %>%
plot_qq_numeric()
# Using pipes ---------------------------------
library(dplyr)
# Plot of all numerical variables
heartfailure %>%
plot_qq_numeric()
 # Using groupd_df ------------------------------
heartfailure %>%
group_by(smoking) %>%
plot_qq_numeric()
# Using groupd_df ------------------------------
heartfailure %>%
group_by(smoking) %>%
plot_qq_numeric()
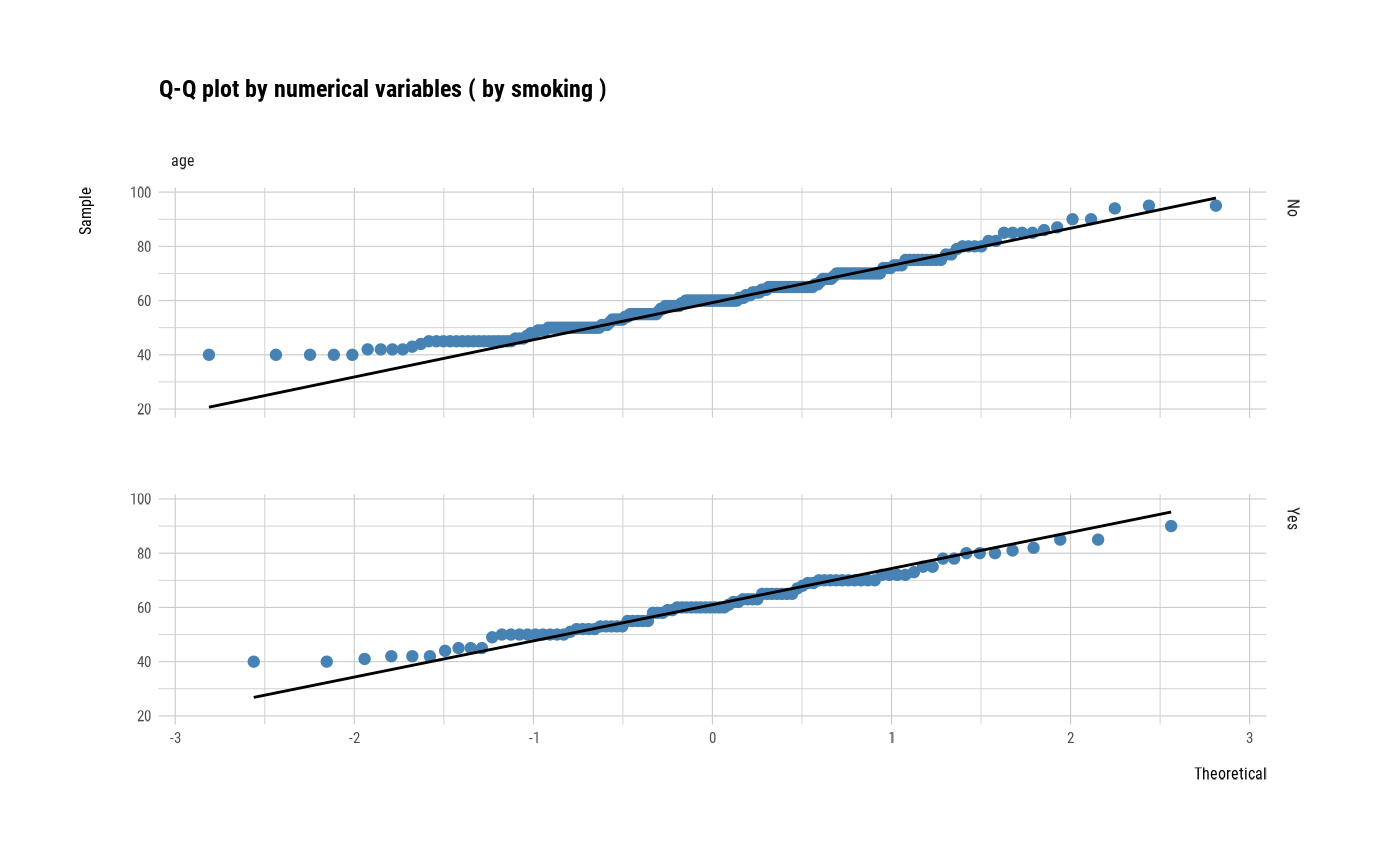
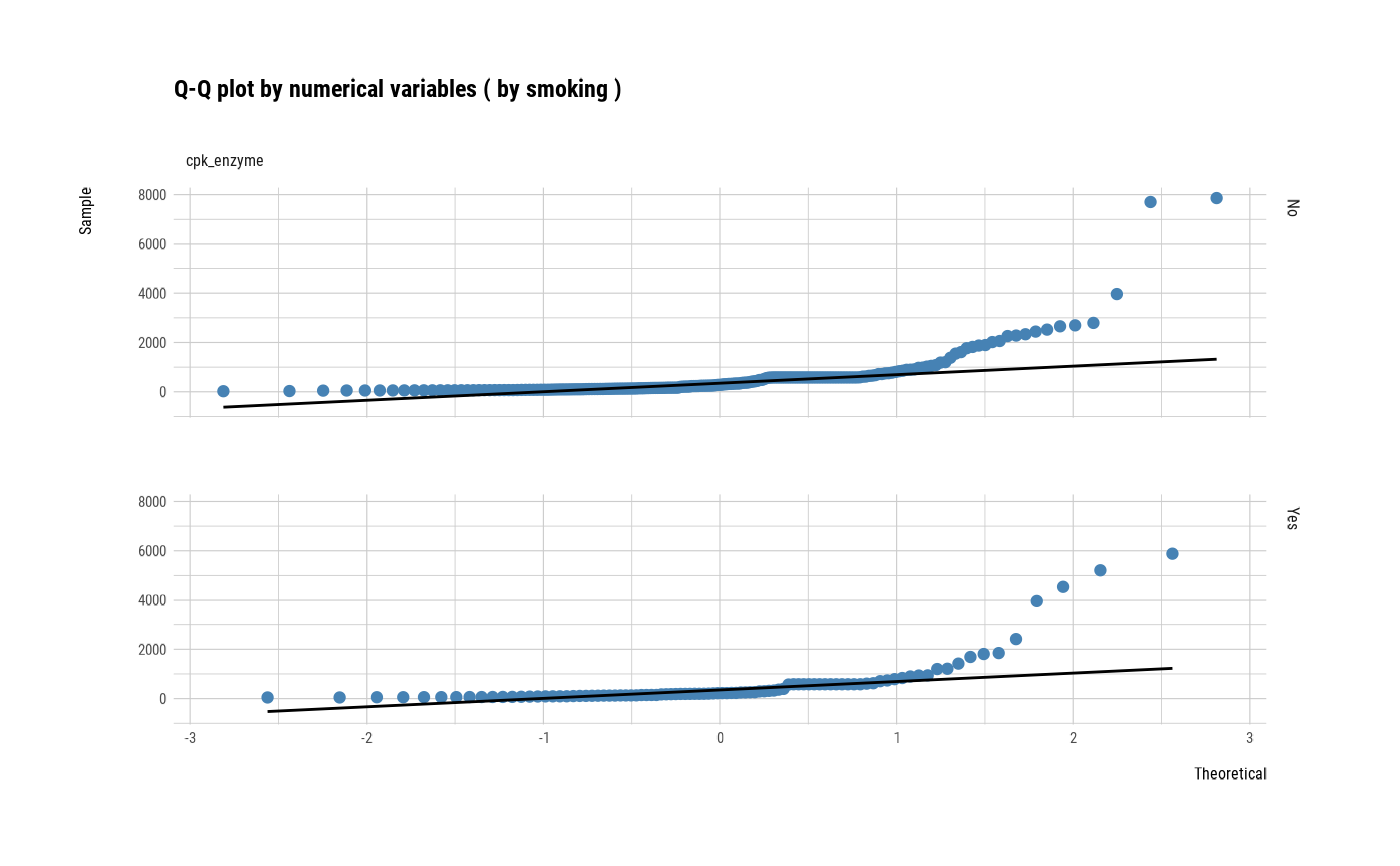
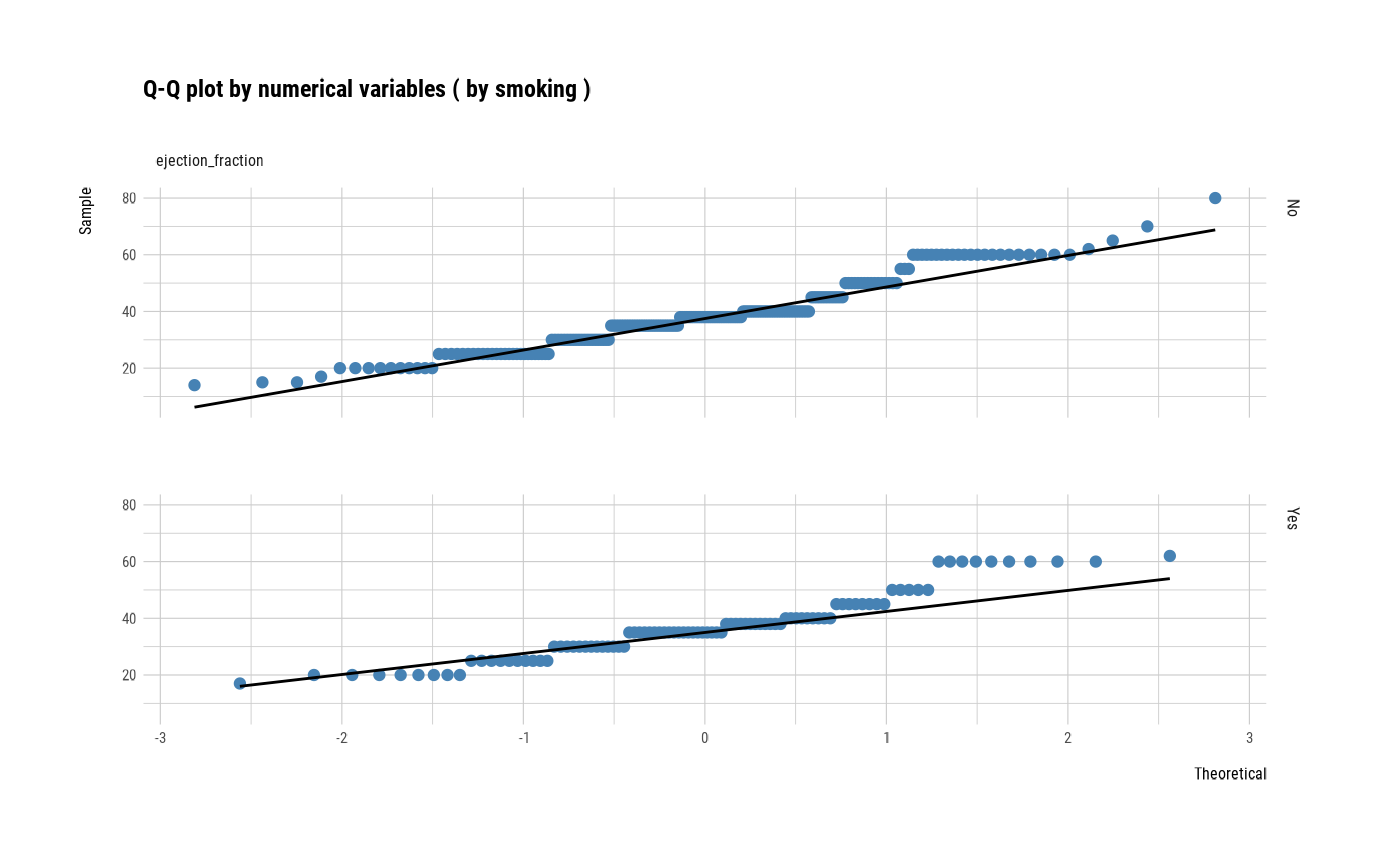
 heartfailure %>%
group_by(smoking) %>%
plot_qq_numeric(each = TRUE)
heartfailure %>%
group_by(smoking) %>%
plot_qq_numeric(each = TRUE)
 # }
# }