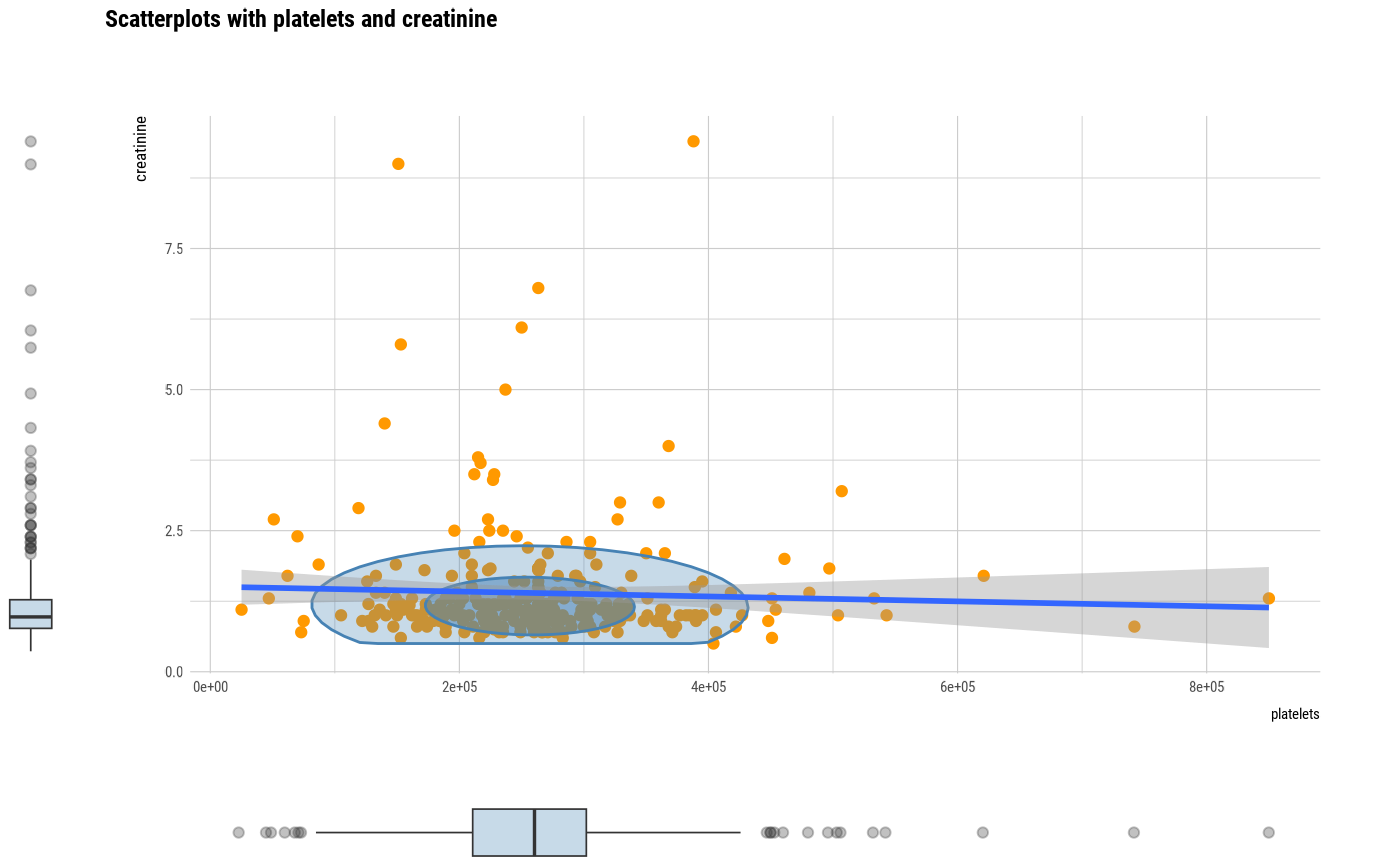
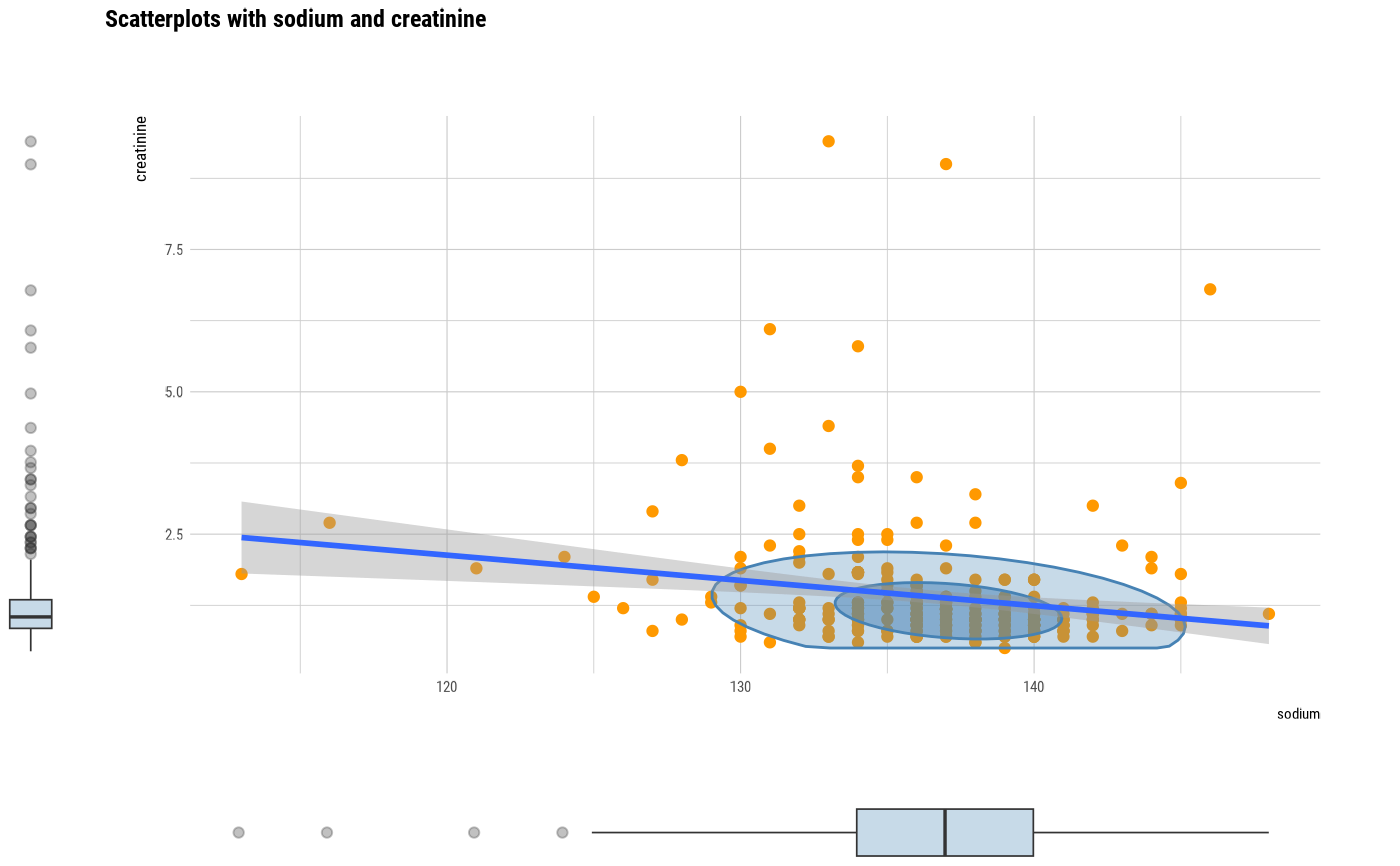
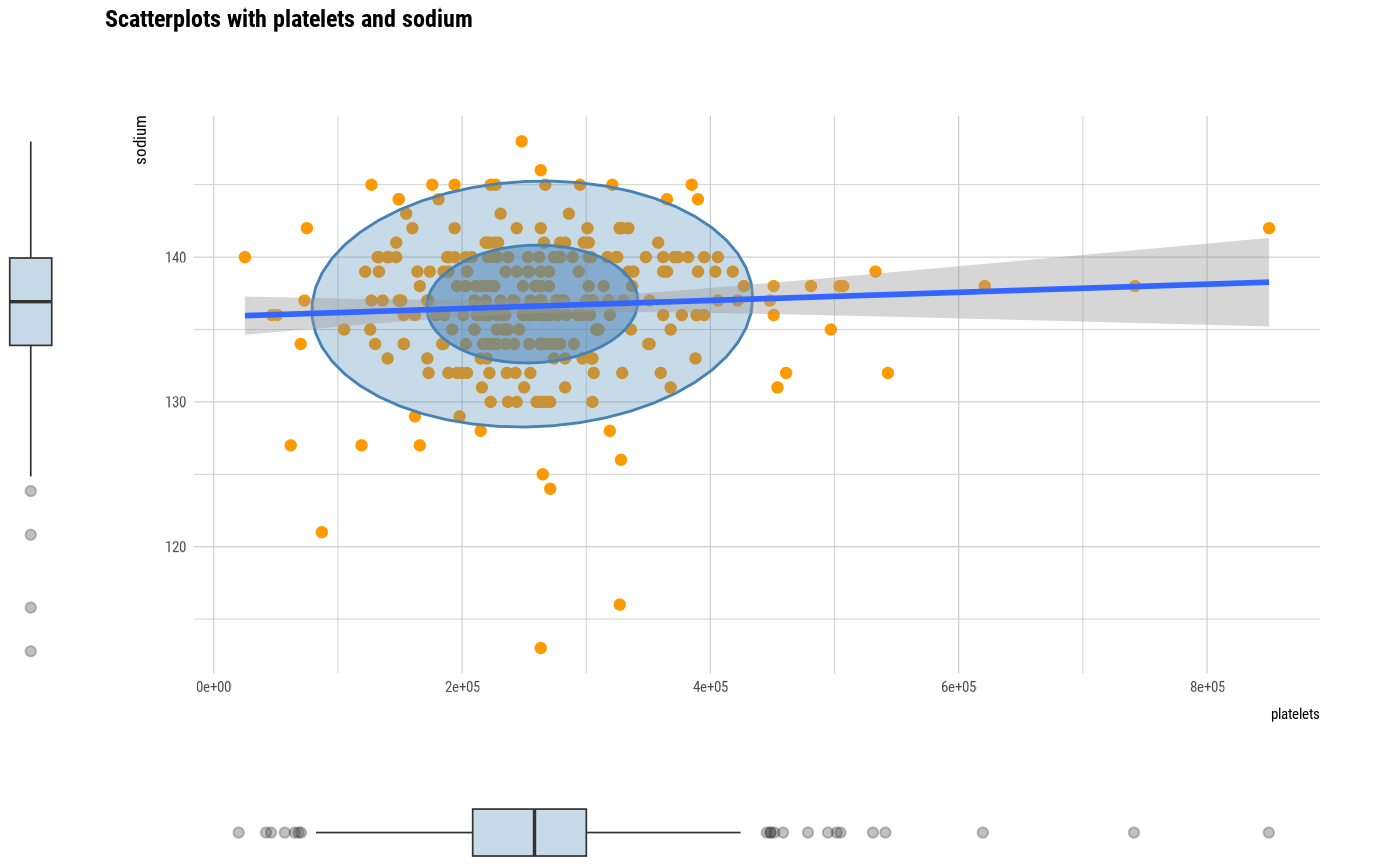
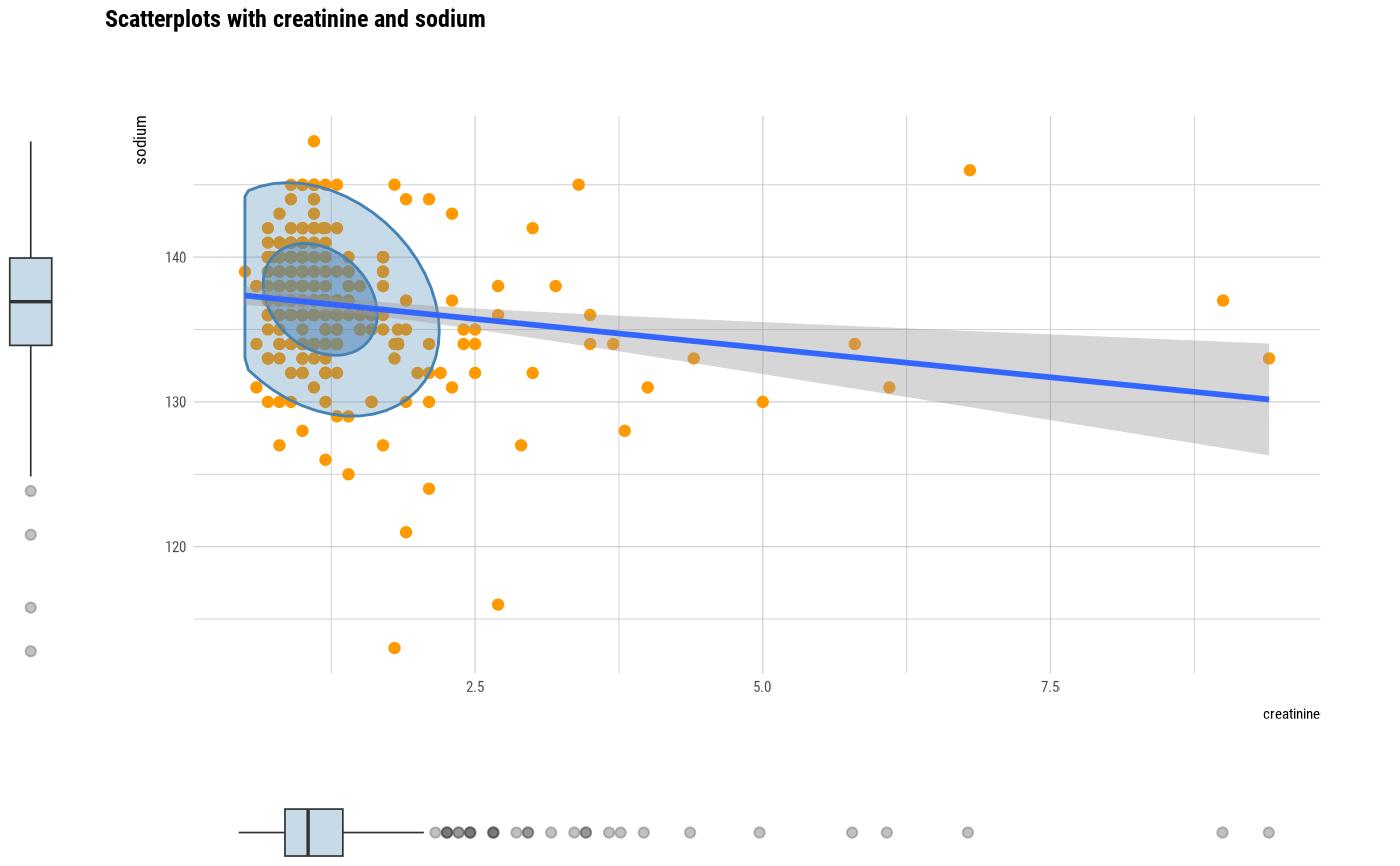
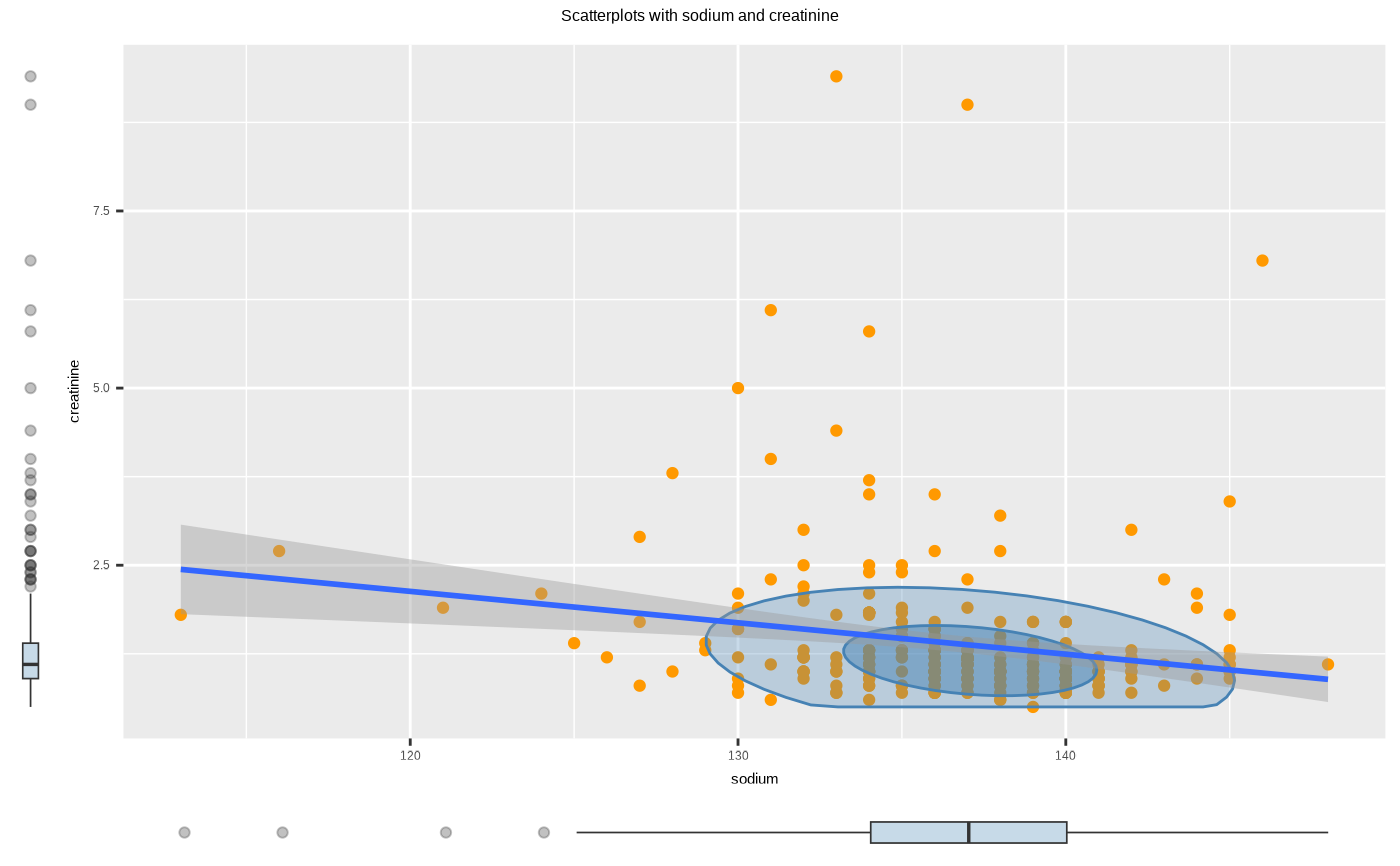
Visualize scatter plot included box plots by attribute of compare_numeric class.
# S3 method for class 'compare_numeric'
plot(x, prompt = FALSE, typographic = TRUE, base_family = NULL, ...)
Arguments
- x
an object of class "compare_numeric", usually, a result of a call to compare_numeric().
- prompt
logical. The default value is FALSE. If there are multiple visualizations to be output, if this argument value is TRUE, a prompt is output each time.
- typographic
logical. Whether to apply focuses on typographic elements to ggplot2 visualization. The default is TRUE. if TRUE provides a base theme that focuses on typographic elements using.
- base_family
character. The name of the base font family to use for the visualization. If not specified, the font defined in dlookr is applied. (See details)
- ...
arguments to be passed to methods, such as graphical parameters (see par). However, it does not support.
Value
NULL. This function just draws a plot.
Details
The base_family is selected from "Roboto Condensed", "Liberation Sans Narrow", "NanumSquare", "Noto Sans Korean". If you want to use a different font, use it after loading the Google font with import_google_font().
Examples
# \donttest{
# Generate data for the example
heartfailure2 <- heartfailure[, c("platelets", "creatinine", "sodium")]
library(dplyr)
# Compare the all numerical variables
all_var <- compare_numeric(heartfailure2)
# Print compare_numeric class object
all_var
#> $correlation
#> # A tibble: 3 × 3
#> var1 var2 coef_corr
#> <chr> <chr> <dbl>
#> 1 platelets creatinine -0.0412
#> 2 platelets sodium 0.0621
#> 3 creatinine sodium -0.189
#>
#> $linear
#> # A tibble: 3 × 14
#> var1 var2 r.squared adj.r.squared sigma statistic p.value df logLik
#> <chr> <chr> <dbl> <dbl> <dbl> <dbl> <dbl> <dbl> <dbl>
#> 1 platelets crea… 0.00170 -0.00166 9.79e4 0.505 0.478 1 -3859.
#> 2 platelets sodi… 0.00386 0.000505 9.78e4 1.15 0.284 1 -3859.
#> 3 creatinine sodi… 0.0358 0.0325 1.02e0 11.0 0.00102 1 -428.
#> # ℹ 5 more variables: AIC <dbl>, BIC <dbl>, deviance <dbl>, df.residual <int>,
#> # nobs <int>
#>
# Compare the two numerical variables
two_var <- compare_numeric(heartfailure2, sodium, creatinine)
# Print compare_numeric class objects
two_var
#> $correlation
#> # A tibble: 1 × 3
#> var1 var2 coef_corr
#> <chr> <chr> <dbl>
#> 1 sodium creatinine -0.189
#>
#> $linear
#> # A tibble: 1 × 14
#> var1 var2 r.squared adj.r.squared sigma statistic p.value df logLik AIC
#> <chr> <chr> <dbl> <dbl> <dbl> <dbl> <dbl> <dbl> <dbl> <dbl>
#> 1 sodi… crea… 0.0358 0.0325 4.34 11.0 0.00102 1 -862. 1730.
#> # ℹ 4 more variables: BIC <dbl>, deviance <dbl>, df.residual <int>, nobs <int>
#>
# plot all pair of variables
plot(all_var)

 # plot a pair of variables
plot(two_var)
# plot a pair of variables
plot(two_var)
 # plot all pair of variables by prompt
plot(all_var, prompt = TRUE)
# plot all pair of variables by prompt
plot(all_var, prompt = TRUE)

 # plot a pair of variables not focuses on typographic elements
plot(two_var, typographic = FALSE)
# plot a pair of variables not focuses on typographic elements
plot(two_var, typographic = FALSE)
 # }
# }