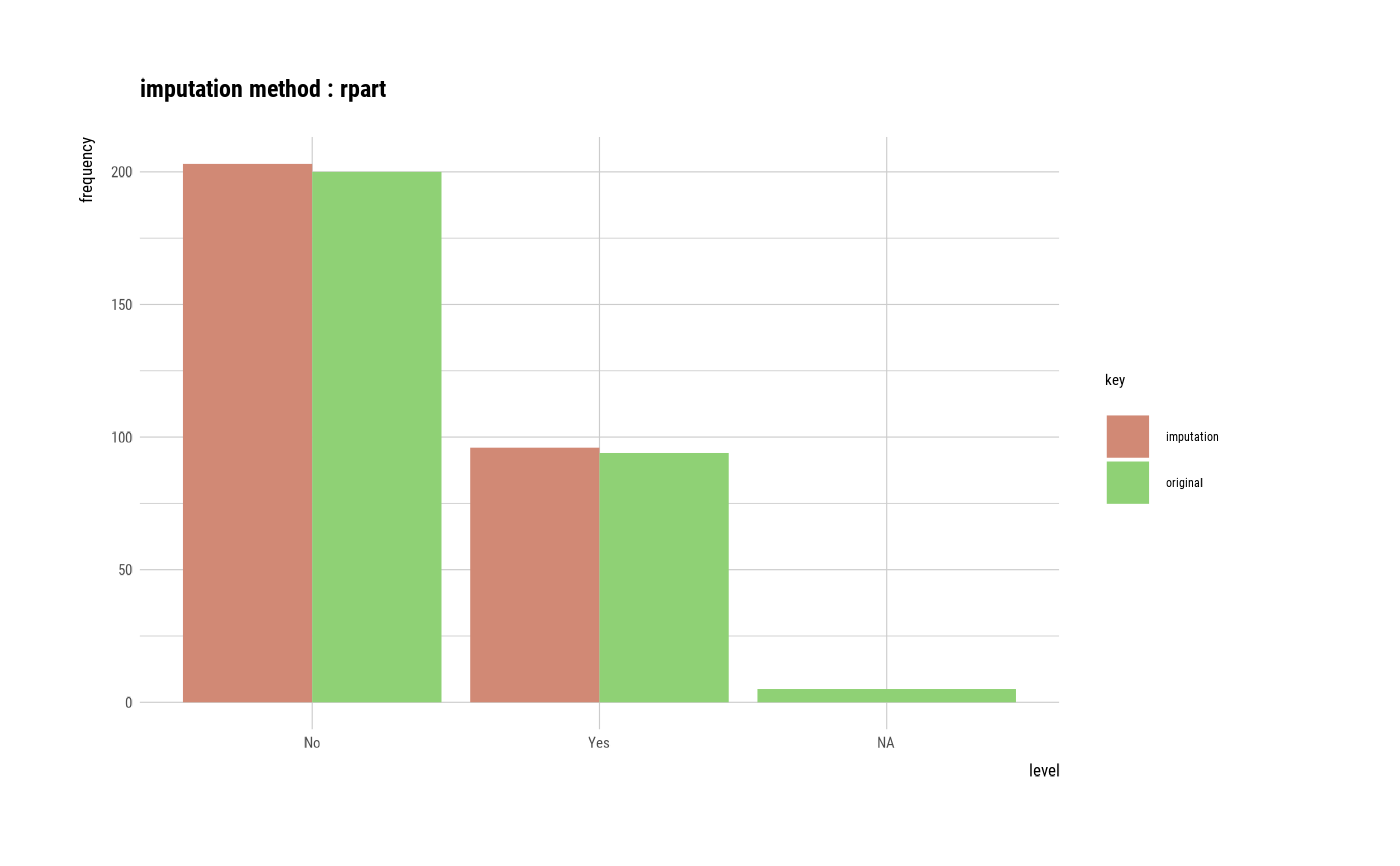
Visualize two kinds of plot by attribute of `imputation` class. The imputation of a numerical variable is a density plot, and the imputation of a categorical variable is a bar plot.
# S3 method for class 'imputation'
plot(x, typographic = TRUE, base_family = NULL, ...)
Arguments
- x
an object of class "imputation", usually, a result of a call to imputate_na() or imputate_outlier().
- typographic
logical. Whether to apply focuses on typographic elements to ggplot2 visualization. The default is TRUE. if TRUE provides a base theme that focuses on typographic elements.
- base_family
character. The name of the base font family to use for the visualization. If not specified, the font defined in dlookr is applied. (See details)
- ...
arguments to be passed to methods, such as graphical parameters (see par). only applies when the model argument is TRUE, and is used for ... of the plot.lm() function.
Value
A ggplot2 object.
Details
The base_family is selected from "Roboto Condensed", "Liberation Sans Narrow", "NanumSquare", "Noto Sans Korean". If you want to use a different font, use it after loading the Google font with import_google_font().
See also
Examples
# Generate data for the example
heartfailure2 <- heartfailure
heartfailure2[sample(seq(NROW(heartfailure2)), 20), "platelets"] <- NA
heartfailure2[sample(seq(NROW(heartfailure2)), 5), "smoking"] <- NA
# Impute missing values -----------------------------
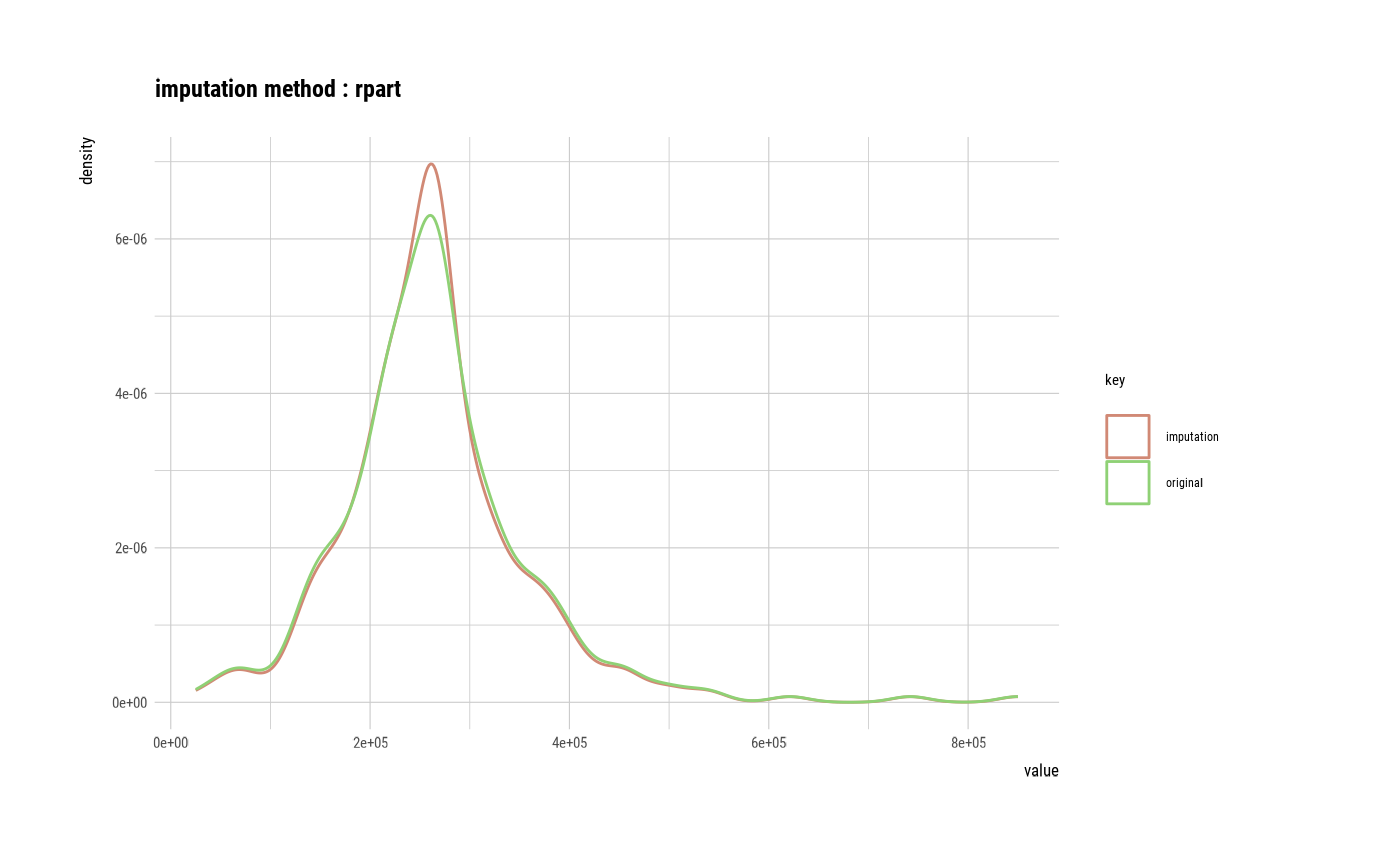
# If the variable of interest is a numerical variables
platelets <- imputate_na(heartfailure2, platelets, yvar = death_event, method = "rpart")
plot(platelets)
 # If the variable of interest is a categorical variables
smoking <- imputate_na(heartfailure2, smoking, yvar = death_event, method = "rpart")
plot(smoking)
# If the variable of interest is a categorical variables
smoking <- imputate_na(heartfailure2, smoking, yvar = death_event, method = "rpart")
plot(smoking)
 # Impute outliers ----------------------------------
# If the variable of interest is a numerical variable
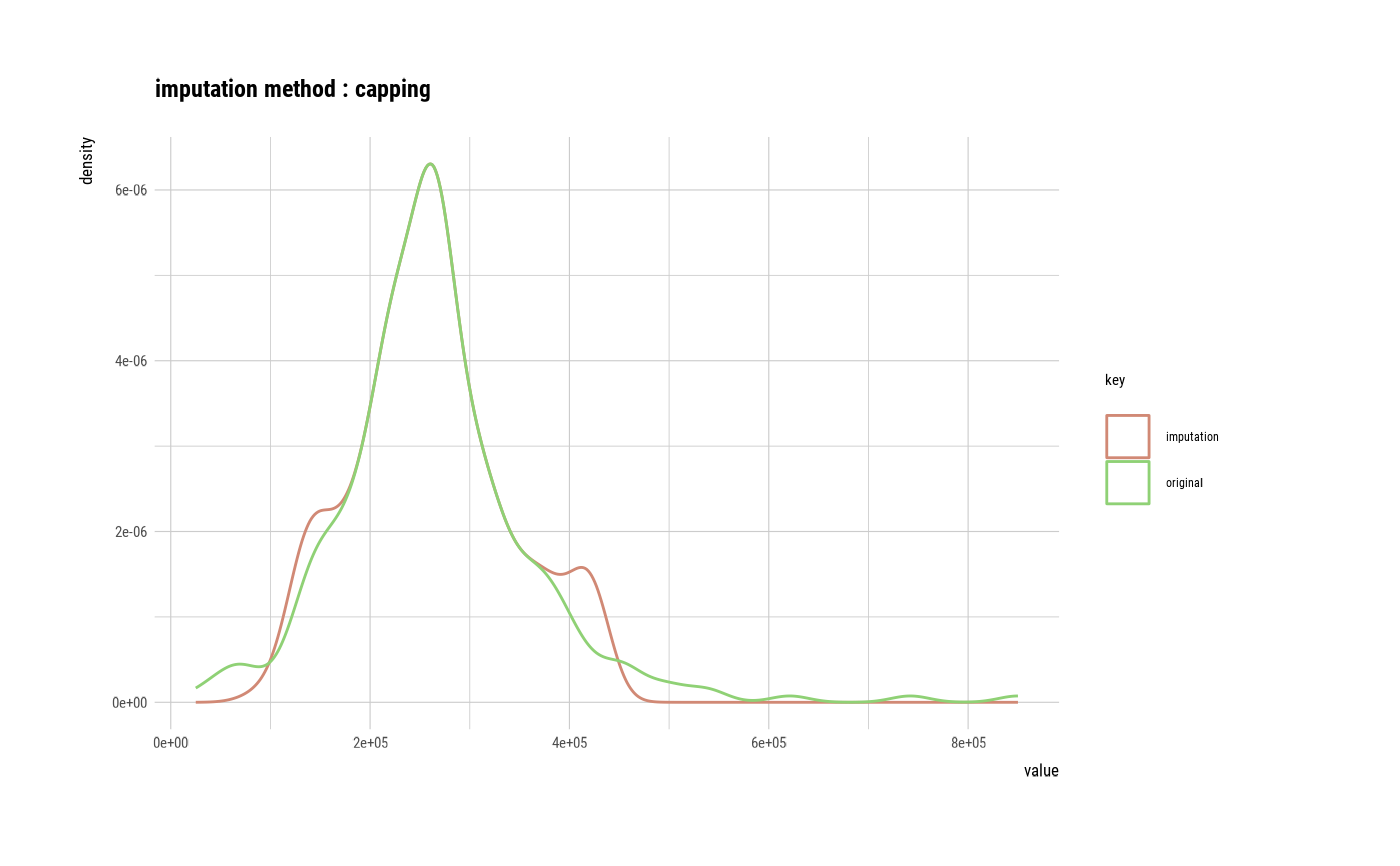
platelets <- imputate_outlier(heartfailure2, platelets, method = "capping")
plot(platelets)
# Impute outliers ----------------------------------
# If the variable of interest is a numerical variable
platelets <- imputate_outlier(heartfailure2, platelets, method = "capping")
plot(platelets)