It generates plots for understand distribution and distribution by target variable using infogain_bins.
Arguments
- x
an object of class "infogain_bins", usually, a result of a call to binning_rgr().
- type
character. options for visualization. Distribution("bar"), Relative Frequency by target ("cross").
- typographic
logical. Whether to apply focuses on typographic elements to ggplot2 visualization. The default is TRUE. if TRUE provides a base theme that focuses on typographic elements.
- base_family
character. The name of the base font family to use for the visualization. If not specified, the font defined in dlookr is applied. (See details)
- ...
further arguments to be passed from or to other methods.
Value
An object of gtable class.
Details
The base_family is selected from "Roboto Condensed", "Liberation Sans Narrow", "NanumSquare", "Noto Sans Korean". If you want to use a different font, use it after loading the Google font with import_google_font().
See also
Examples
# \donttest{
# binning by recursive information gain ratio maximization using character
bin <- binning_rgr(heartfailure, "death_event", "creatinine")
# binning by recursive information gain ratio maximization using name
bin <- binning_rgr(heartfailure, death_event, creatinine)
bin
#> binned type: infogain
#> number of bins: 5
#> x
#> [0.5,1.0) 1.0 [1.1,1.2) [1.2,1.7) [1.7,9.4]
#> 81 50 43 64 61
# summary optimal_bins class
summary(bin)
#> levels freq rate
#> 1 [0.5,1.0) 81 0.2709030
#> 2 1.0 50 0.1672241
#> 3 [1.1,1.2) 43 0.1438127
#> 4 [1.2,1.7) 64 0.2140468
#> 5 [1.7,9.4] 61 0.2040134
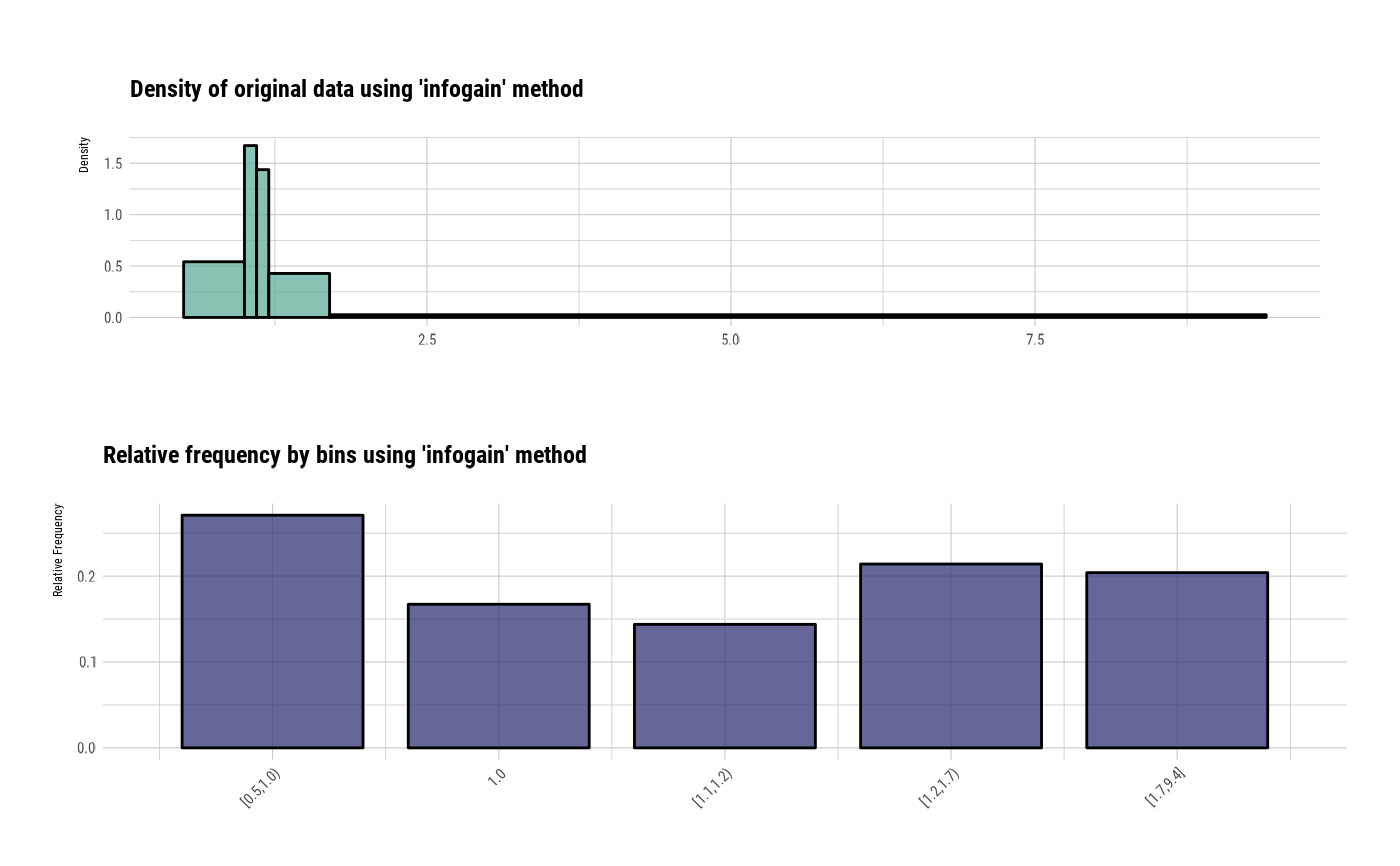
# visualize all information for optimal_bins class
plot(bin)
#> Don't know how to automatically pick scale for object of type <table>.
#> Defaulting to continuous.
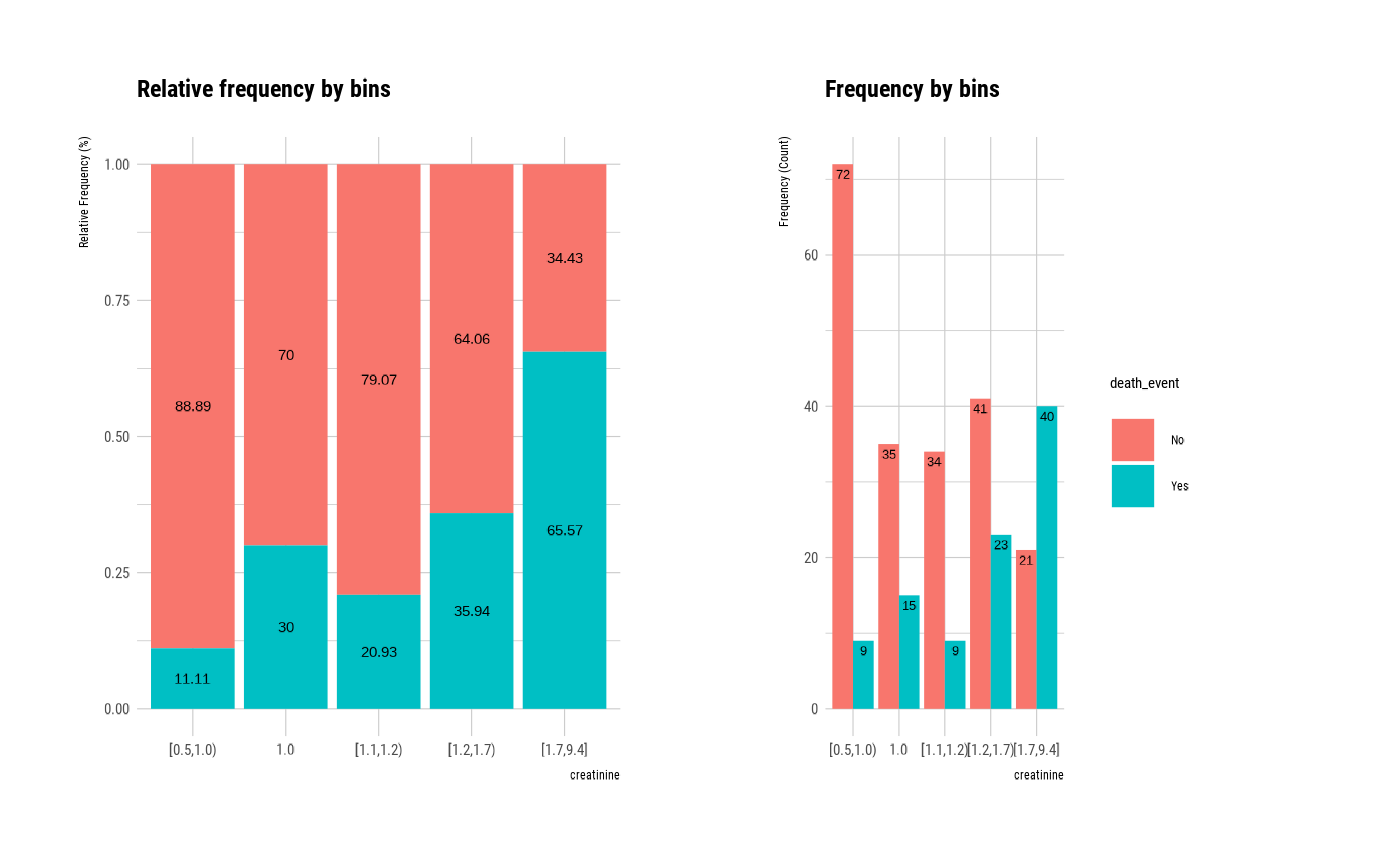
 # visualize WoE information for optimal_bins class
plot(bin, type = "cross")
# visualize WoE information for optimal_bins class
plot(bin, type = "cross")
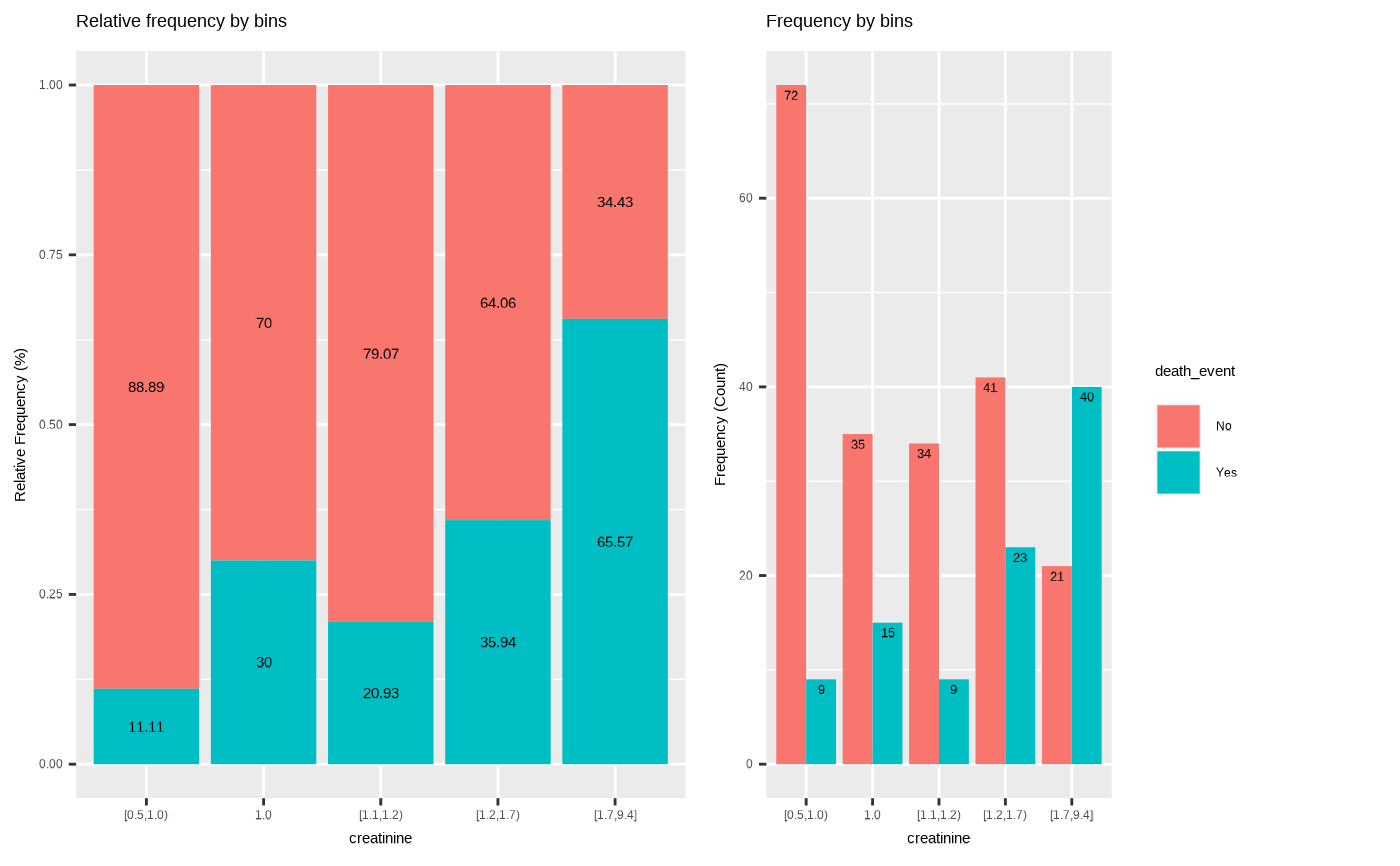
 # visualize all information without typographic
plot(bin, type = "cross", typographic = FALSE)
# visualize all information without typographic
plot(bin, type = "cross", typographic = FALSE)
 # }
# }