Visualize Information for an "univar_category" Object
Source:R/univariate.R
plot.univar_category.RdVisualize mosaics plot by attribute of univar_category class.
# S3 method for class 'univar_category'
plot(
  x,
  na.rm = TRUE,
  prompt = FALSE,
  typographic = TRUE,
  base_family = NULL,
  ...
)
Arguments
- x
an object of class "univar_category", usually, a result of a call to univar_category().
- na.rm
logical. Specifies whether to include NA when plotting bar plot. The default is FALSE, so plot NA.
- prompt
logical. The default value is FALSE. If there are multiple visualizations to be output, if this argument value is TRUE, a prompt is output each time.
- typographic
logical. Whether to apply focuses on typographic elements to ggplot2 visualization. The default is TRUE. if TRUE provides a base theme that focuses on typographic elements.
- base_family
character. The name of the base font family to use for the visualization. If not specified, the font defined in dlookr is applied. (See details)
- ...
arguments to be passed to methods, such as graphical parameters (see par). However, it does not support all parameters.
Details
The base_family is selected from "Roboto Condensed", "Liberation Sans Narrow", "NanumSquare", "Noto Sans Korean". If you want to use a different font, use it after loading the Google font with import_google_font().
Examples
# \donttest{
library(dplyr)
# Calculates the all categorical variables
all_var <- univar_category(heartfailure)
# Print univar_category class object
all_var
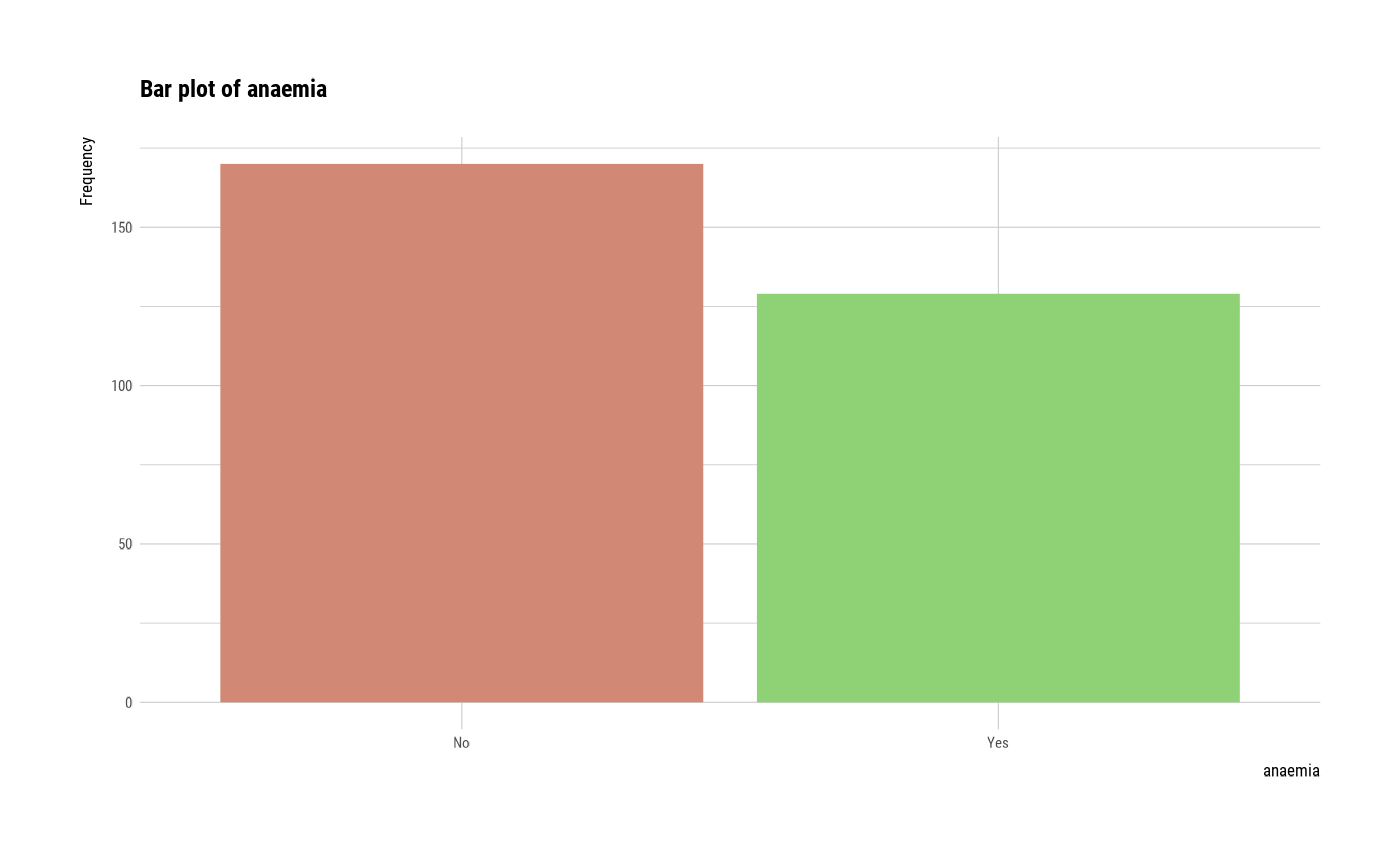
#> $anaemia
#> anaemia n rate
#> 1 No 170 0.5685619
#> 2 Yes 129 0.4314381
#>
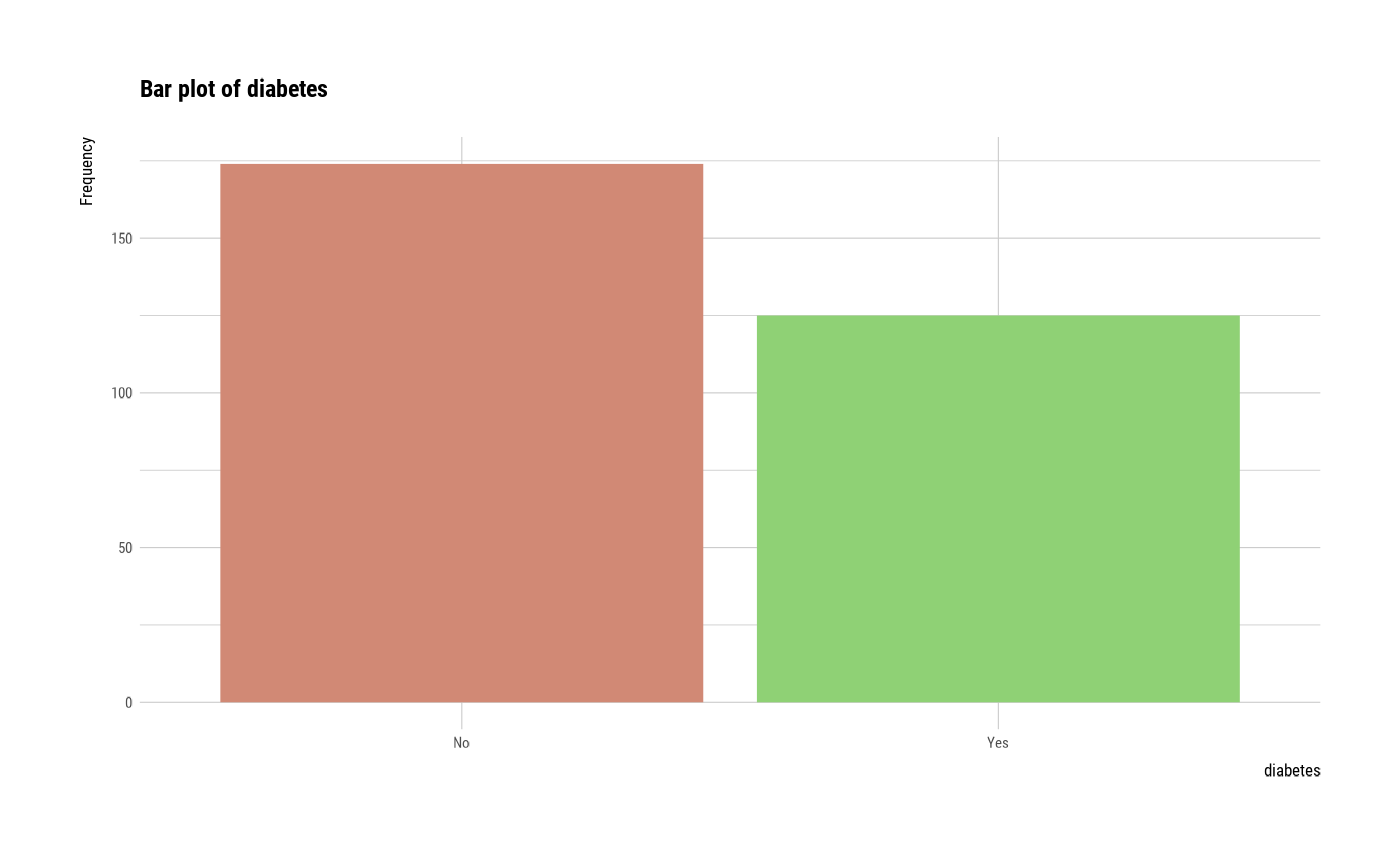
#> $diabetes
#> diabetes n rate
#> 1 No 174 0.5819398
#> 2 Yes 125 0.4180602
#>
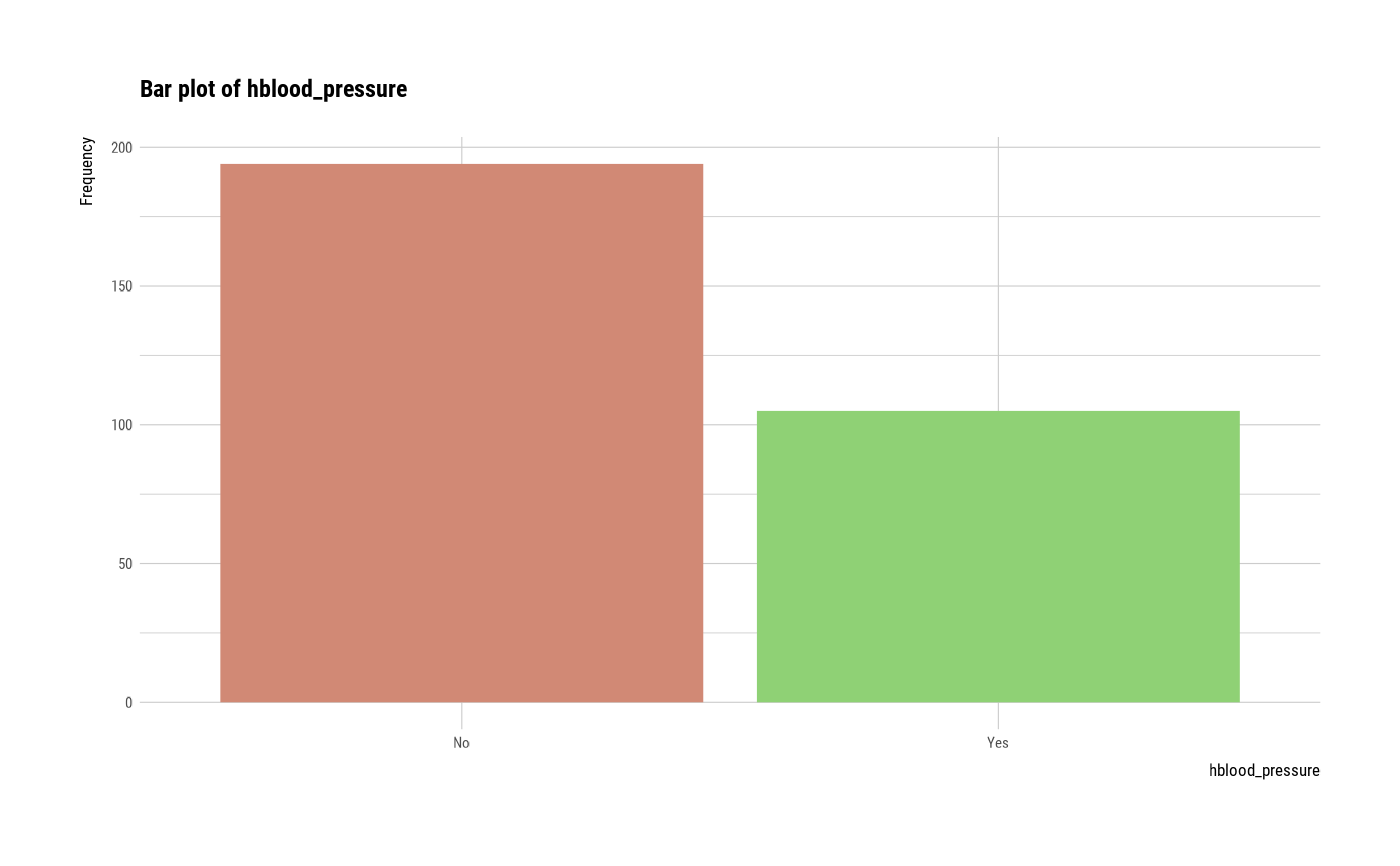
#> $hblood_pressure
#> hblood_pressure n rate
#> 1 No 194 0.6488294
#> 2 Yes 105 0.3511706
#>
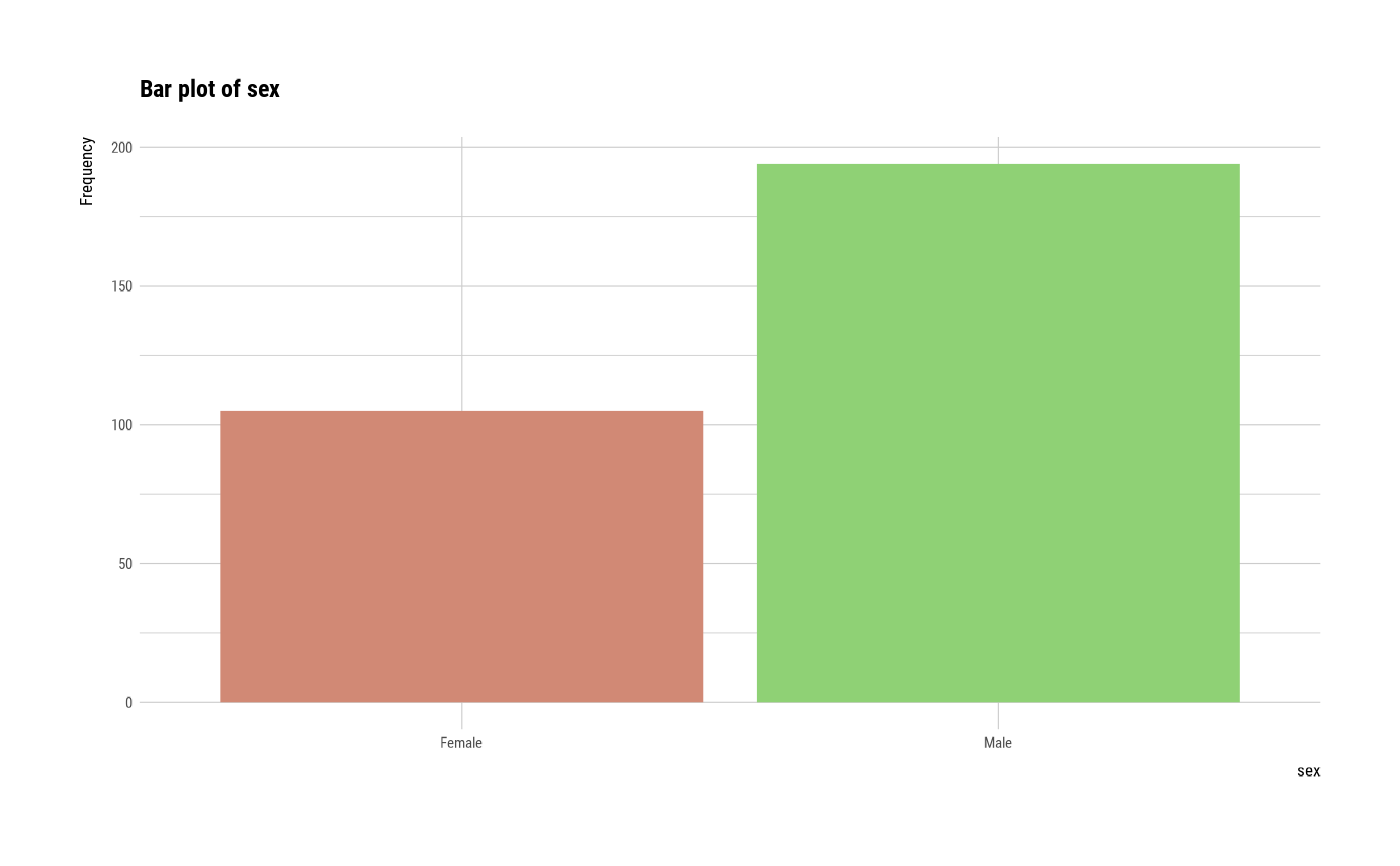
#> $sex
#> sex n rate
#> 1 Female 105 0.3511706
#> 2 Male 194 0.6488294
#>
#> $smoking
#> smoking n rate
#> 1 No 203 0.6789298
#> 2 Yes 96 0.3210702
#>
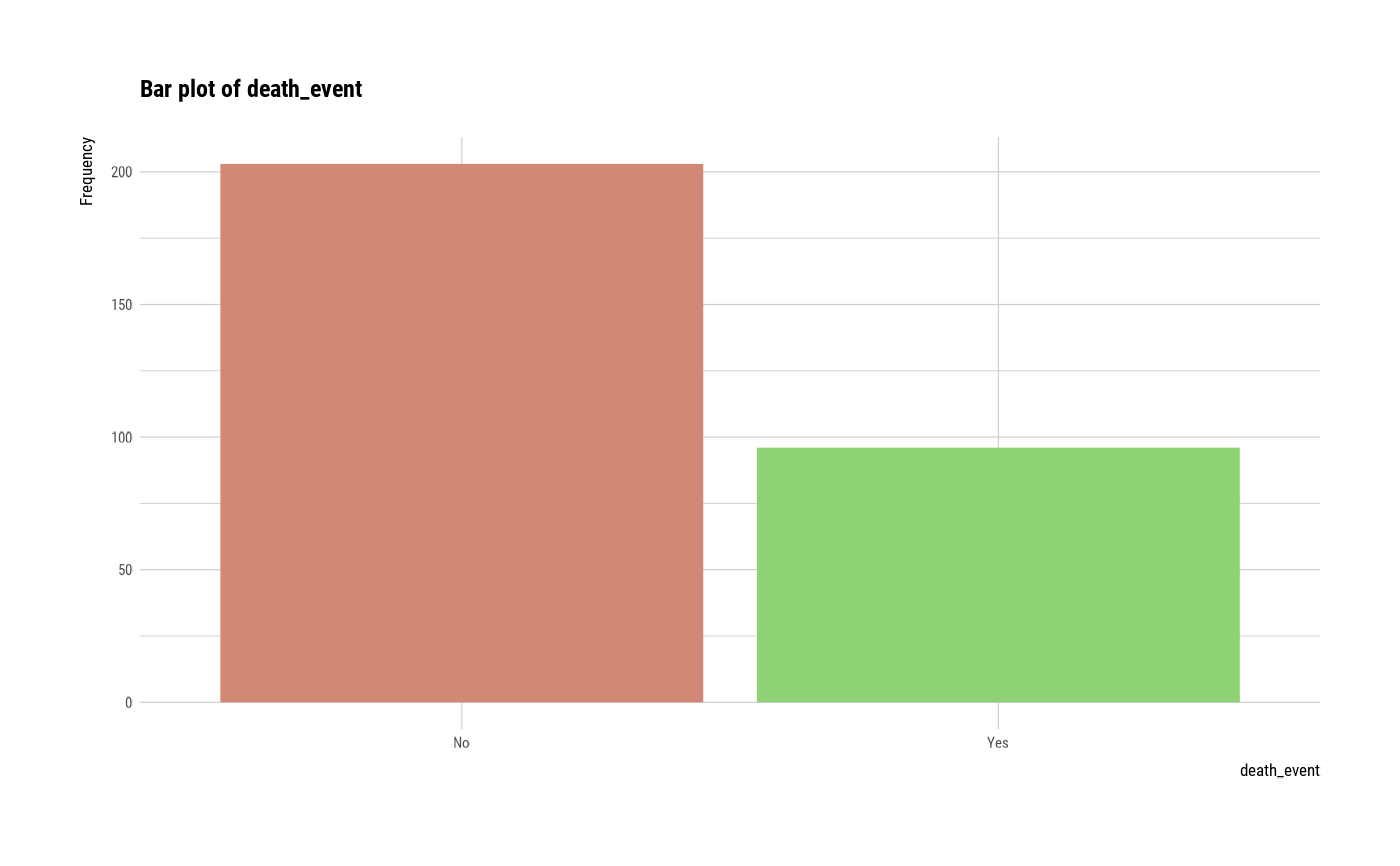
#> $death_event
#> death_event n rate
#> 1 No 203 0.6789298
#> 2 Yes 96 0.3210702
#>
smoking <- univar_category(heartfailure, smoking)
# Print univar_category class object
smoking
#> $smoking
#> smoking n rate
#> 1 No 203 0.6789298
#> 2 Yes 96 0.3210702
#>
# plot all variables
plot(all_var)

 # plot smoking
plot(smoking)
# plot smoking
plot(smoking)
 # }
# }