Visualize boxplots and histogram by attribute of univar_numeric class.
Arguments
- x
an object of class "univar_numeric", usually, a result of a call to univar_numeric().
- indiv
logical. Select whether to display information of all variables in one plot when there are multiple selected numeric variables. In case of FALSE, all variable information is displayed in one plot. If TRUE, the information of the individual variables is output to the individual plots. The default is FALSE. If only one variable is selected, TRUE is applied.
- viz
character. Describe what to plot visualization. "hist" draws a histogram and "boxplot" draws a boxplot. The default is "hist".
- stand
character. Describe how to standardize the original data. "robust" normalizes the raw data through transformation calculated by IQR and median. "minmax" normalizes the original data using minmax transformation. "zscore" standardizes the original data using z-Score transformation. "none" does not perform data transformation. he default is "none" if indiv is TRUE, and "robust" if FALSE.
- prompt
logical. The default value is FALSE. If there are multiple visualizations to be output, if this argument value is TRUE, a prompt is output each time.
- typographic
logical. Whether to apply focuses on typographic elements to ggplot2 visualization. The default is TRUE. if TRUE provides a base theme that focuses on typographic elements.
- base_family
character. The name of the base font family to use for the visualization. If not specified, the font defined in dlookr is applied. (See details)
- ...
arguments to be passed to methods, such as graphical parameters (see par). However, it does not support.
Details
The base_family is selected from "Roboto Condensed", "Liberation Sans Narrow", "NanumSquare", "Noto Sans Korean". If you want to use a different font, use it after loading the Google font with import_google_font().
See also
Examples
# \donttest{
# Calculates the all categorical variables
all_var <- univar_numeric(heartfailure)
# Print univar_numeric class object
all_var
#> $statistics
#> # A tibble: 7 × 10
#> described_variables n na mean sd se_mean IQR skewness
#> <chr> <int> <int> <dbl> <dbl> <dbl> <dbl> <dbl>
#> 1 age 299 0 60.8 11.9 0.688 19 0.424
#> 2 cpk_enzyme 299 0 582. 970. 56.1 466. 4.46
#> 3 ejection_fraction 299 0 38.1 11.8 0.684 15 0.555
#> 4 platelets 299 0 263358. 97804. 5656. 91000 1.46
#> 5 creatinine 299 0 1.39 1.03 0.0598 0.5 4.46
#> 6 sodium 299 0 137. 4.41 0.255 6 -1.05
#> 7 time 299 0 130. 77.6 4.49 130 0.128
#> # ℹ 2 more variables: kurtosis <dbl>, median <dbl>
#>
# Calculates the platelets, sodium variable
univar_numeric(heartfailure, platelets, sodium)
#> $statistics
#> # A tibble: 2 × 10
#> described_variables n na mean sd se_mean IQR skewness kurtosis
#> <chr> <int> <int> <dbl> <dbl> <dbl> <dbl> <dbl> <dbl>
#> 1 platelets 299 0 263358. 9.78e4 5.66e+3 91000 1.46 6.21
#> 2 sodium 299 0 137. 4.41e0 2.55e-1 6 -1.05 4.12
#> # ℹ 1 more variable: median <dbl>
#>
# Summary the all case : Return a invisible copy of an object.
stat <- summary(all_var)
# Summary by returned object
stat
#> # A tibble: 7 × 8
#> described_variables mean sd se_mean IQR skewness kurtosis median
#> <chr> <dbl> <dbl> <dbl> <dbl> <dbl> <dbl> <dbl>
#> 1 age 0.0437 0.626 0.0362 1 0.424 -0.184 0
#> 2 cpk_enzyme 0.713 2.08 0.121 1 4.46 25.1 0
#> 3 ejection_fraction 0.00557 0.789 0.0456 1 0.555 0.0414 0
#> 4 platelets 0.0149 1.07 0.0622 1 1.46 6.21 0
#> 5 creatinine 0.588 2.07 0.120 1 4.46 25.8 0
#> 6 sodium -0.0624 0.735 0.0425 1 -1.05 4.12 0
#> 7 time 0.117 0.597 0.0345 1 0.128 -1.21 0
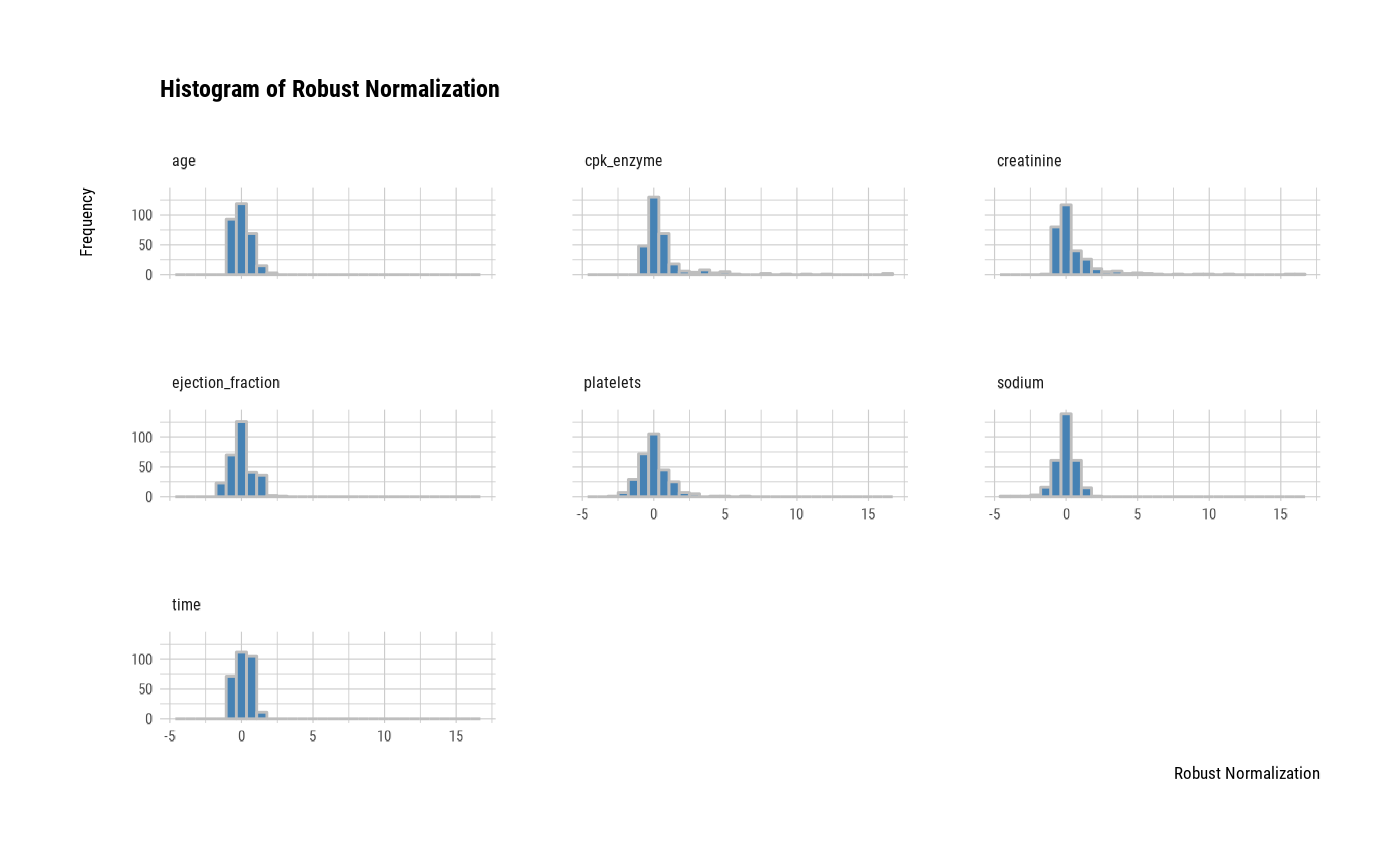
# one plot with all variables
plot(all_var)
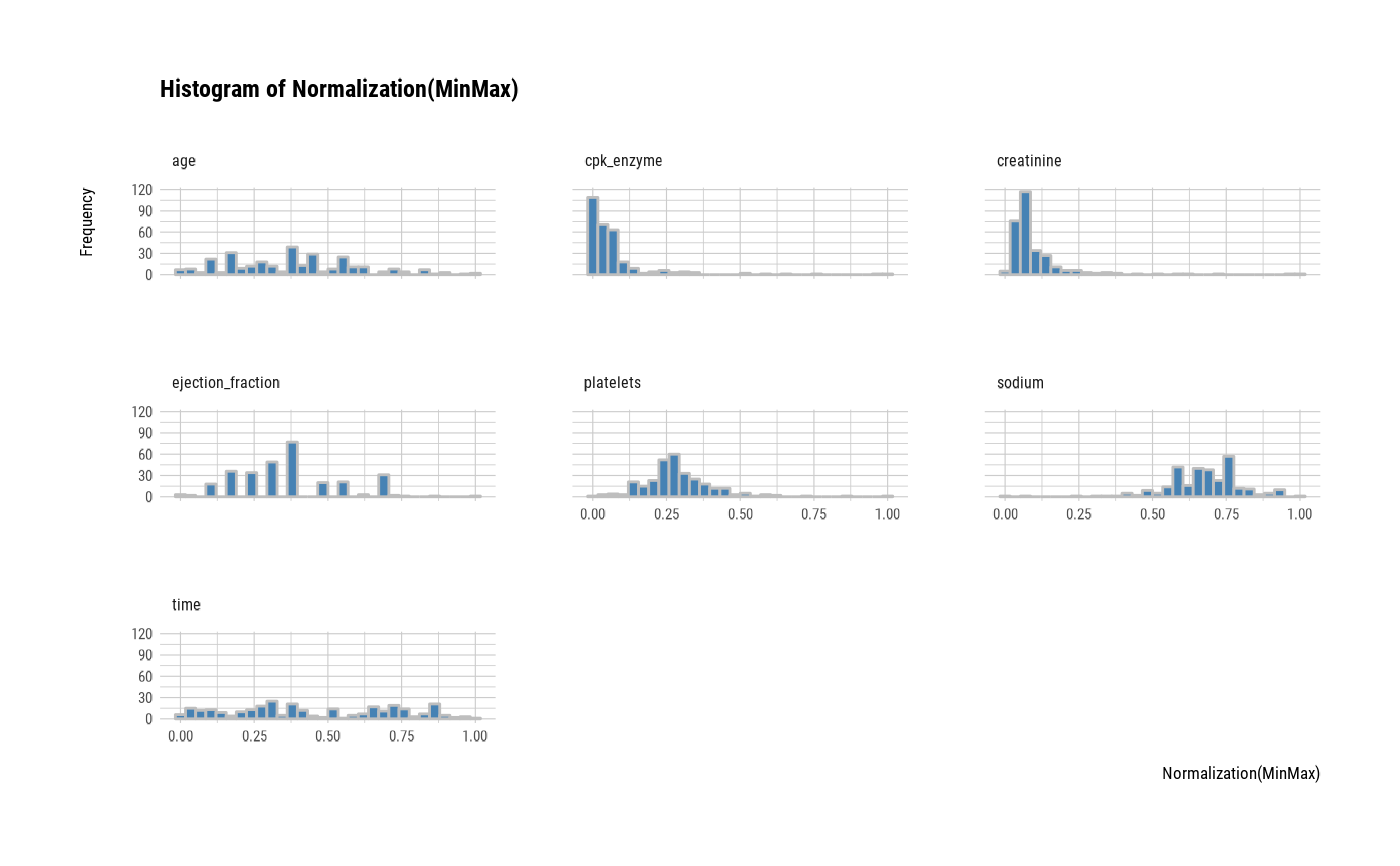
 # one plot with all normalized variables by Min-Max method
plot(all_var, stand = "minmax")
# one plot with all normalized variables by Min-Max method
plot(all_var, stand = "minmax")
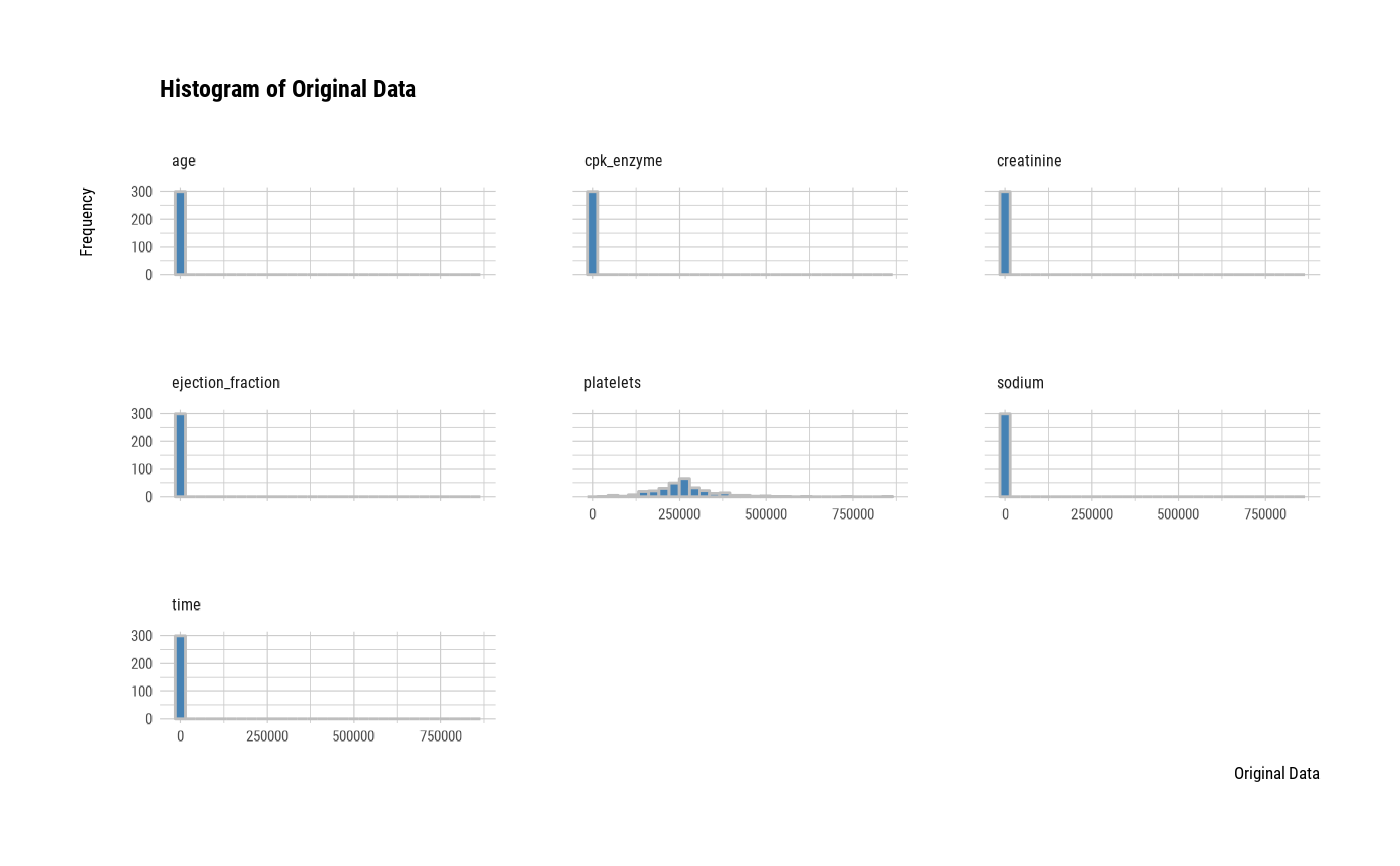
 # one plot with all variables
plot(all_var, stand = "none")
# one plot with all variables
plot(all_var, stand = "none")
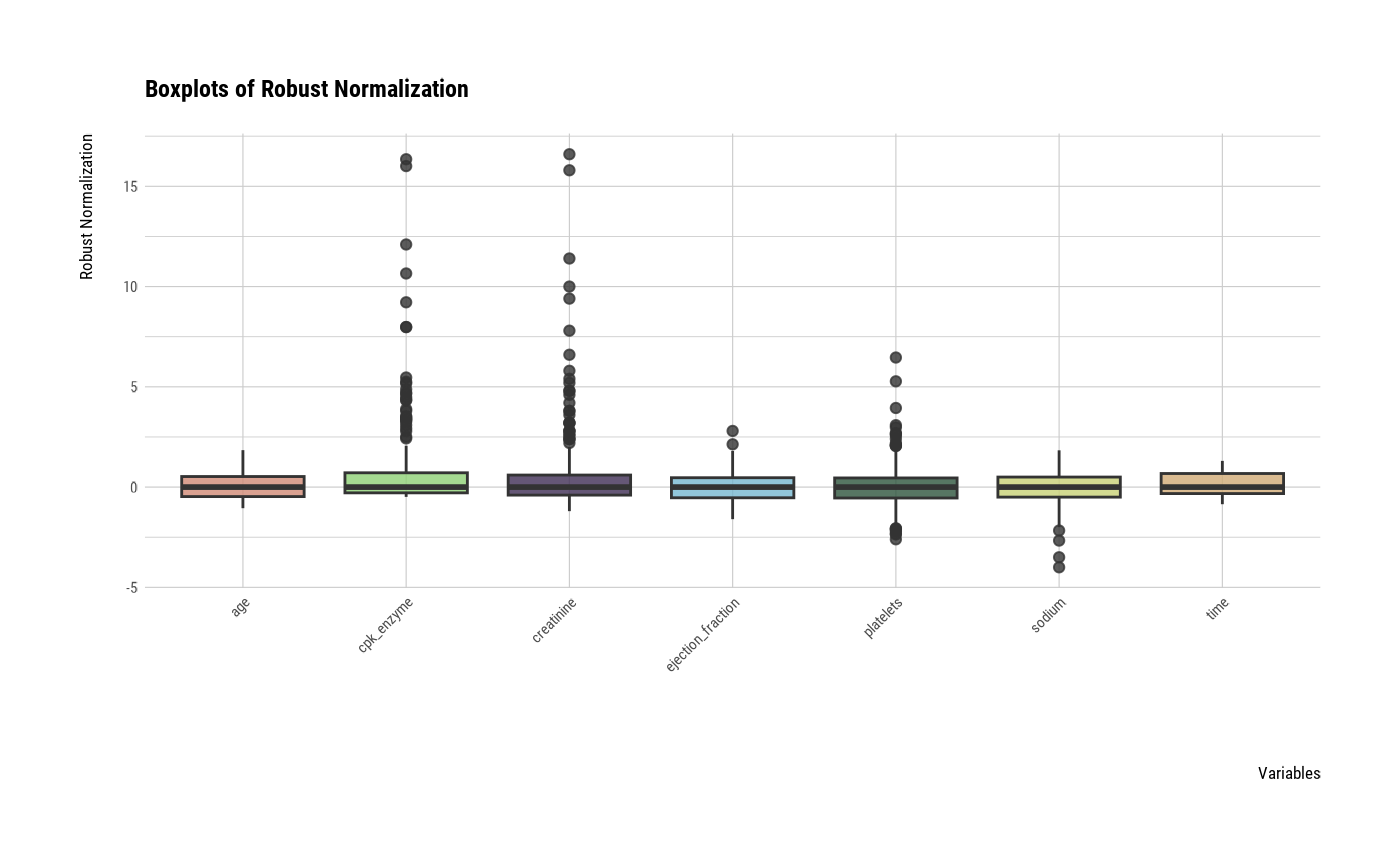
 # one plot with all robust standardized variables
plot(all_var, viz = "boxplot")
# one plot with all robust standardized variables
plot(all_var, viz = "boxplot")
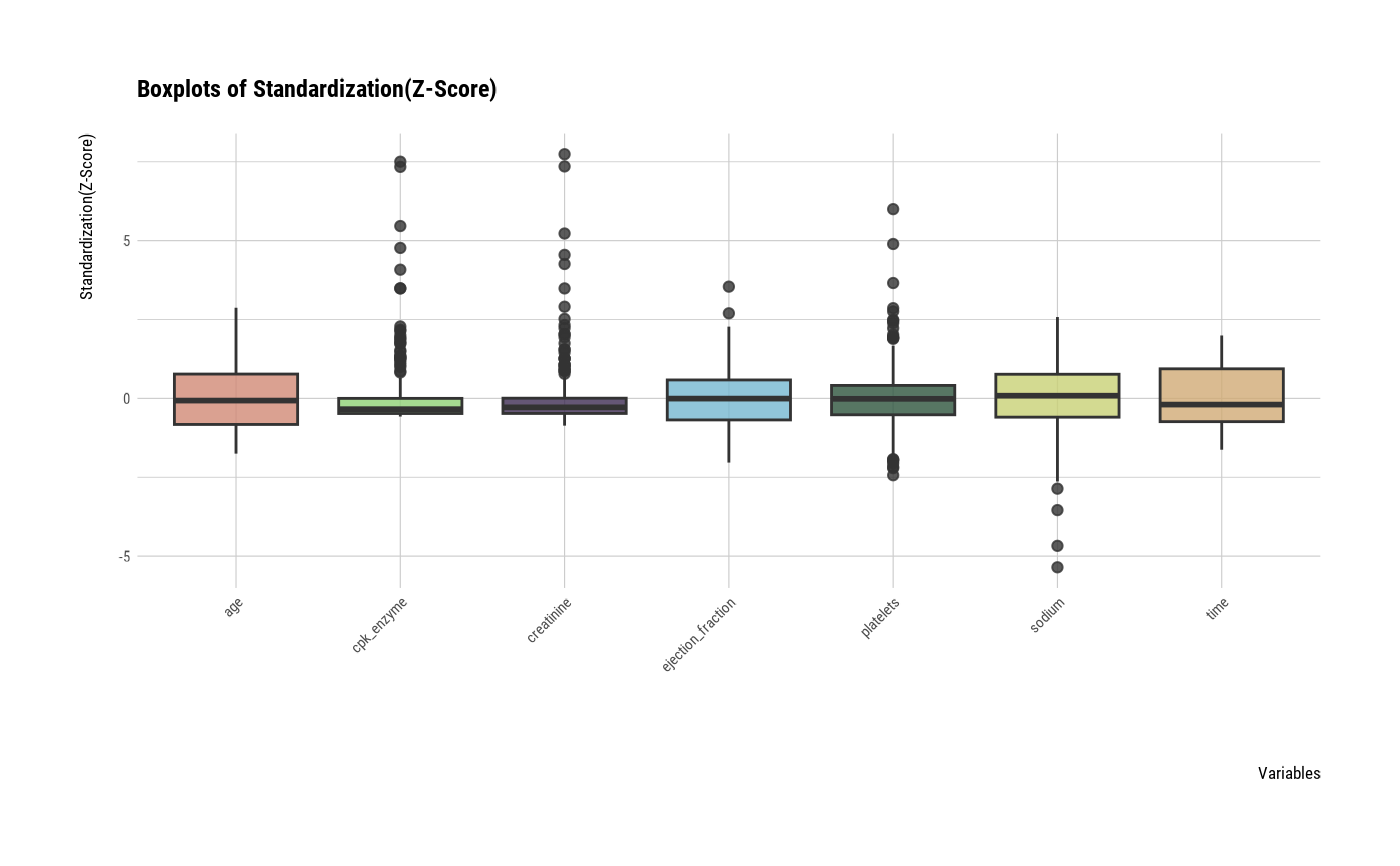
 # one plot with all standardized variables by Z-score method
plot(all_var, viz = "boxplot", stand = "zscore")
# one plot with all standardized variables by Z-score method
plot(all_var, viz = "boxplot", stand = "zscore")
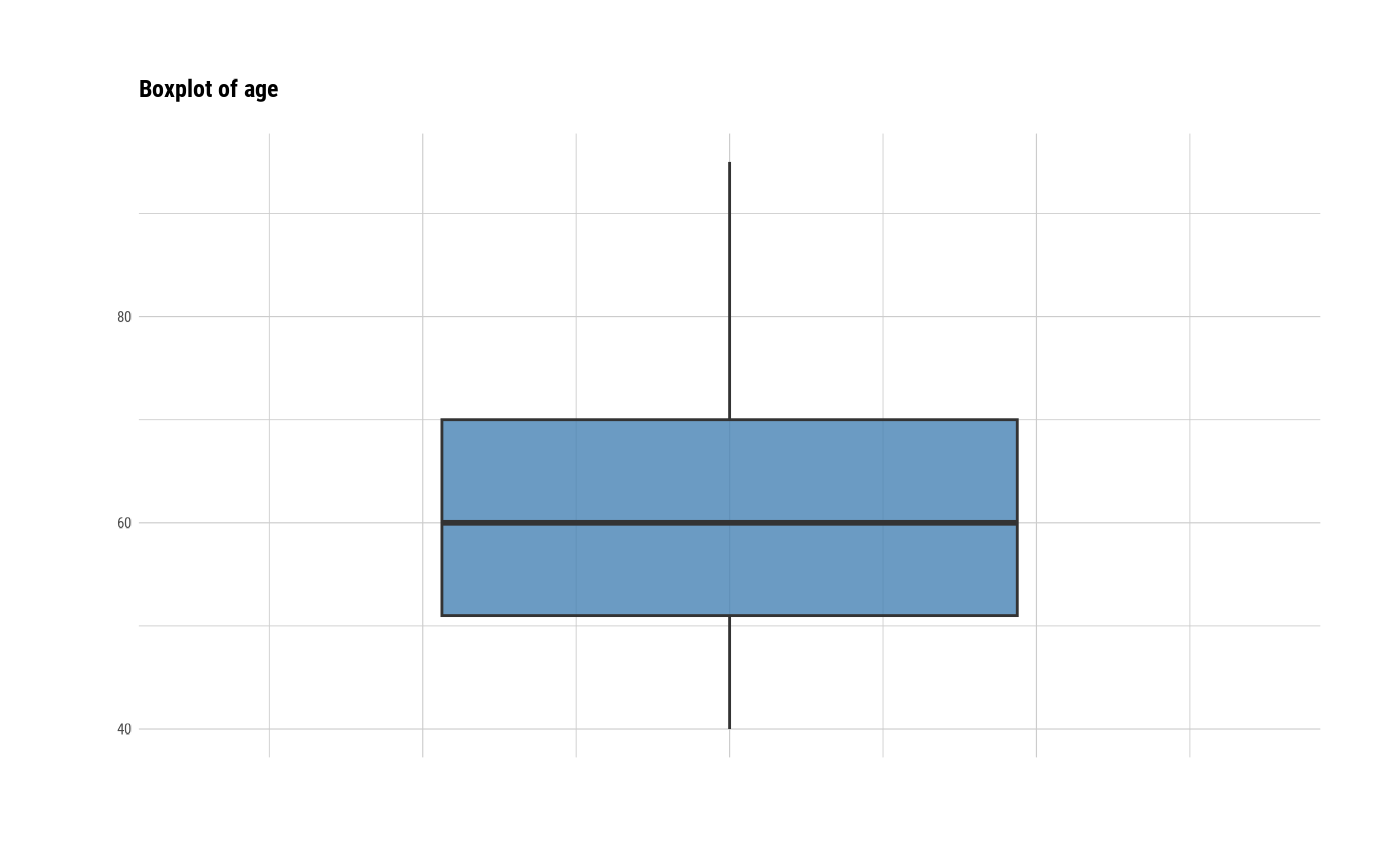
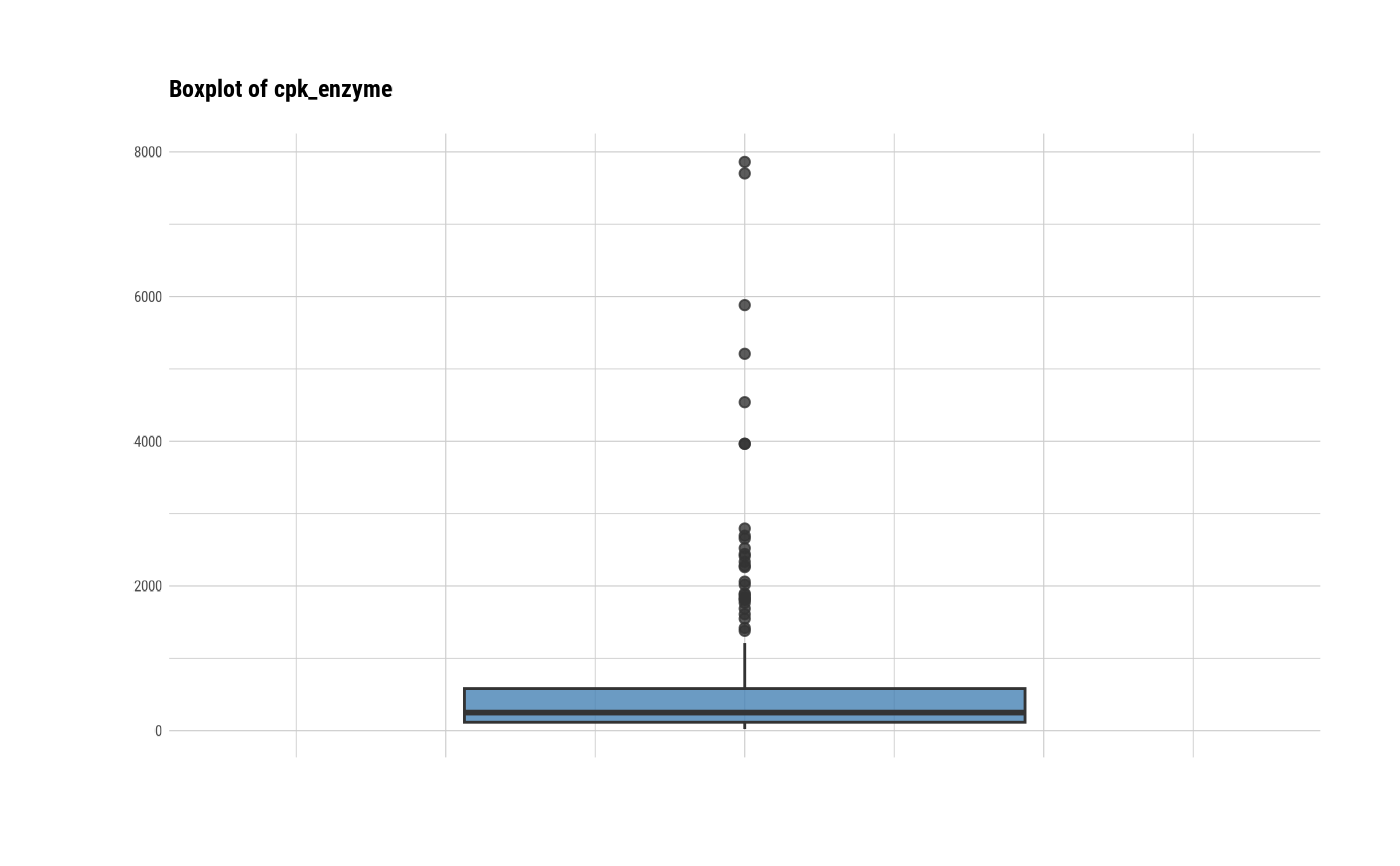
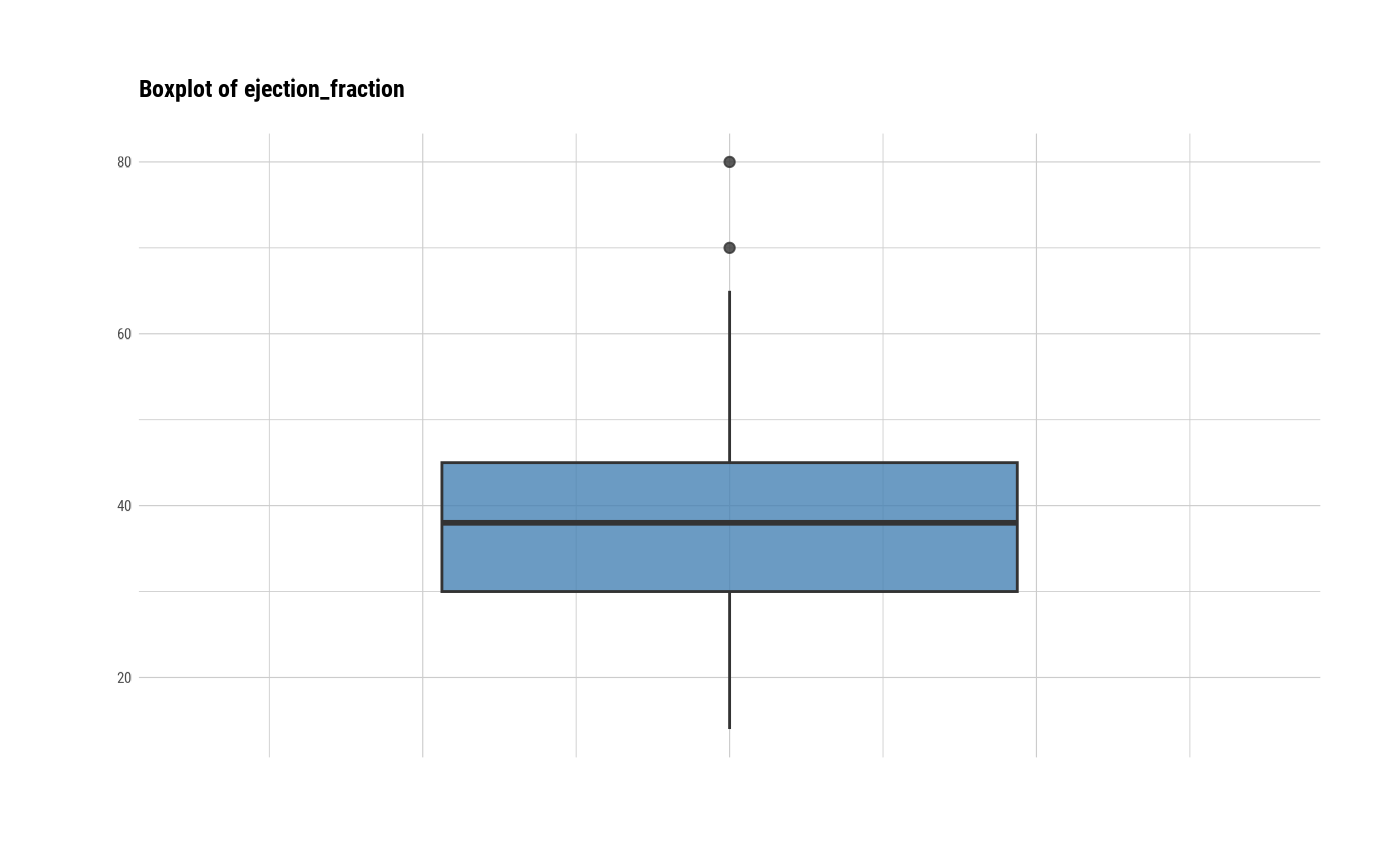
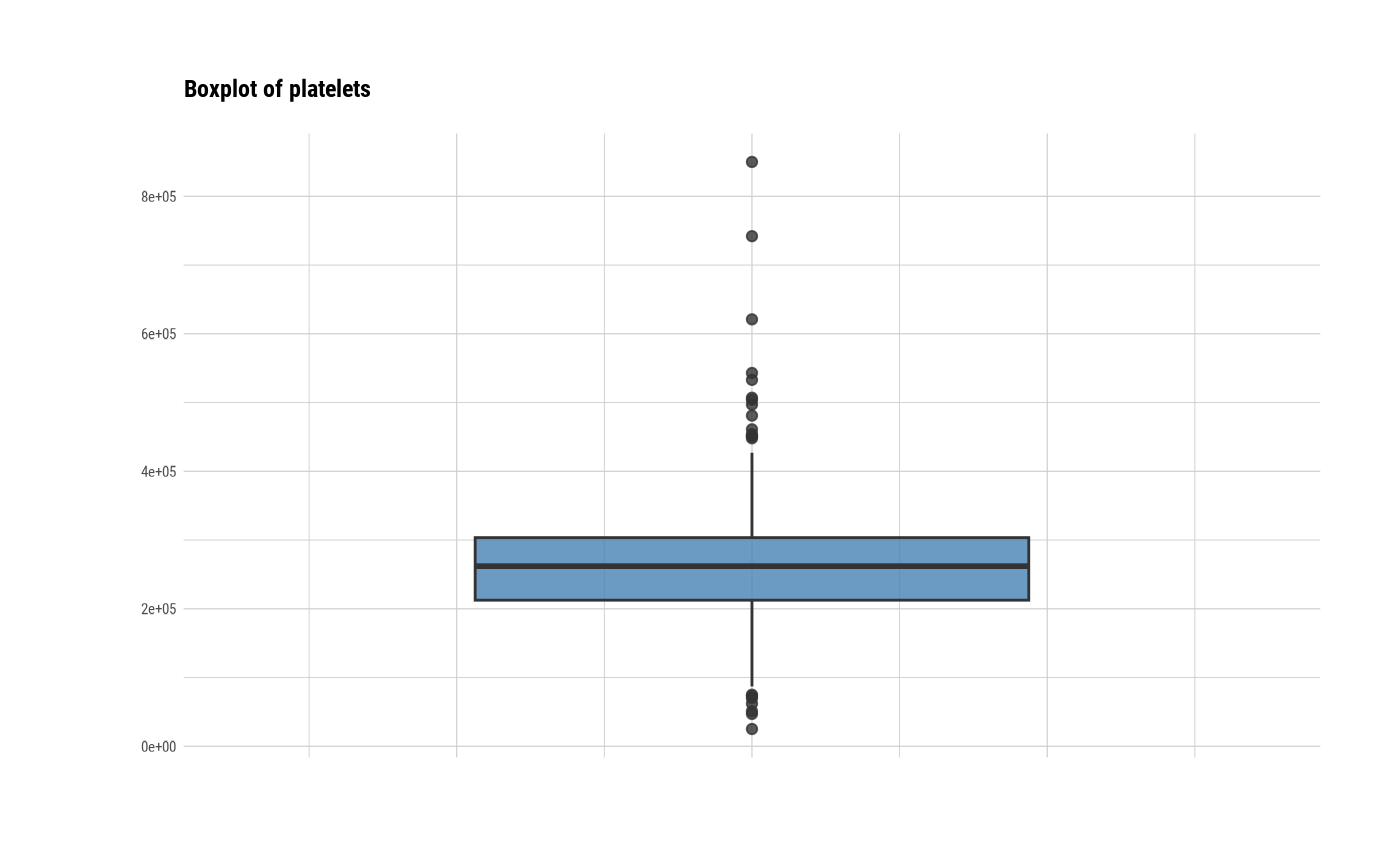
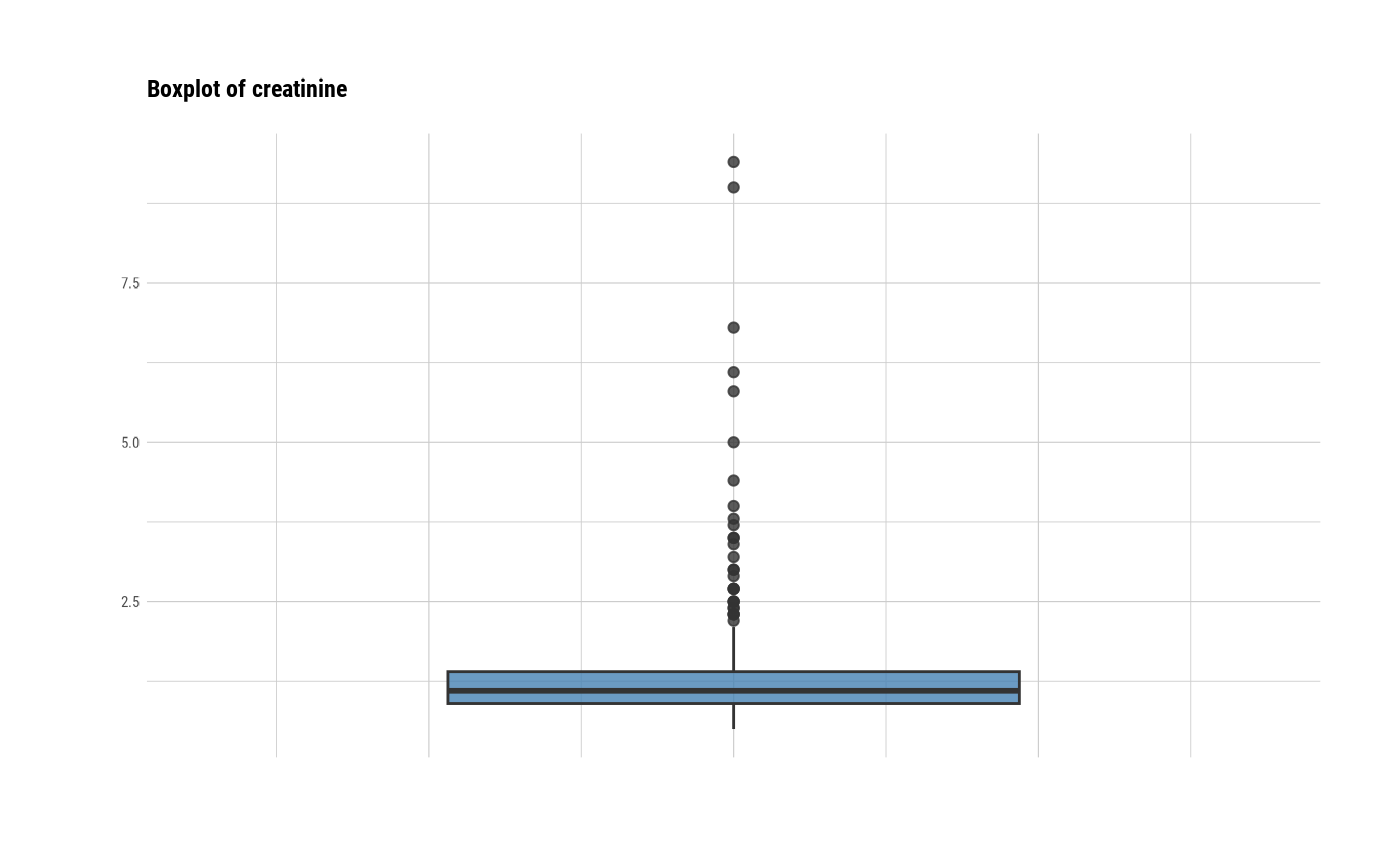
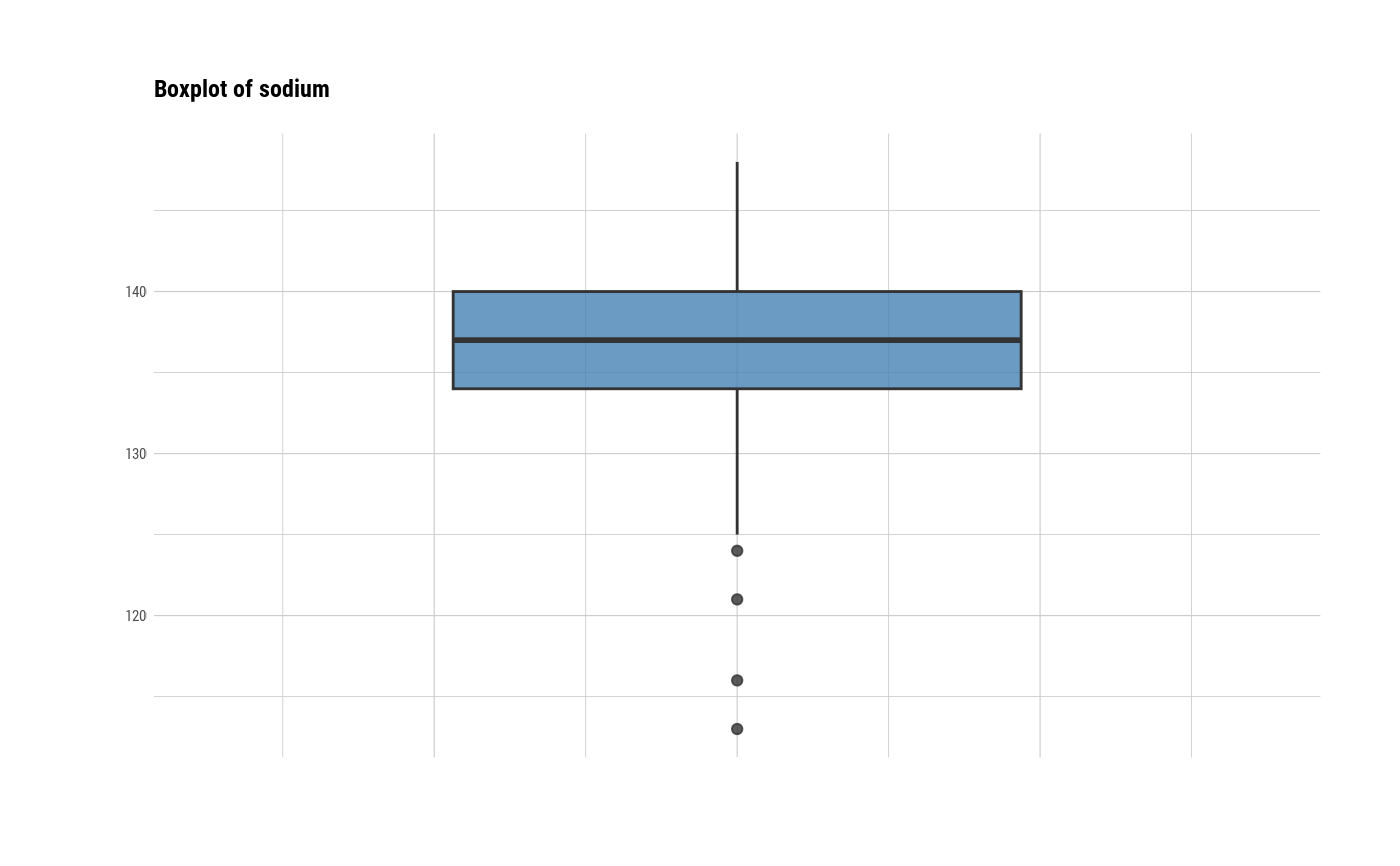
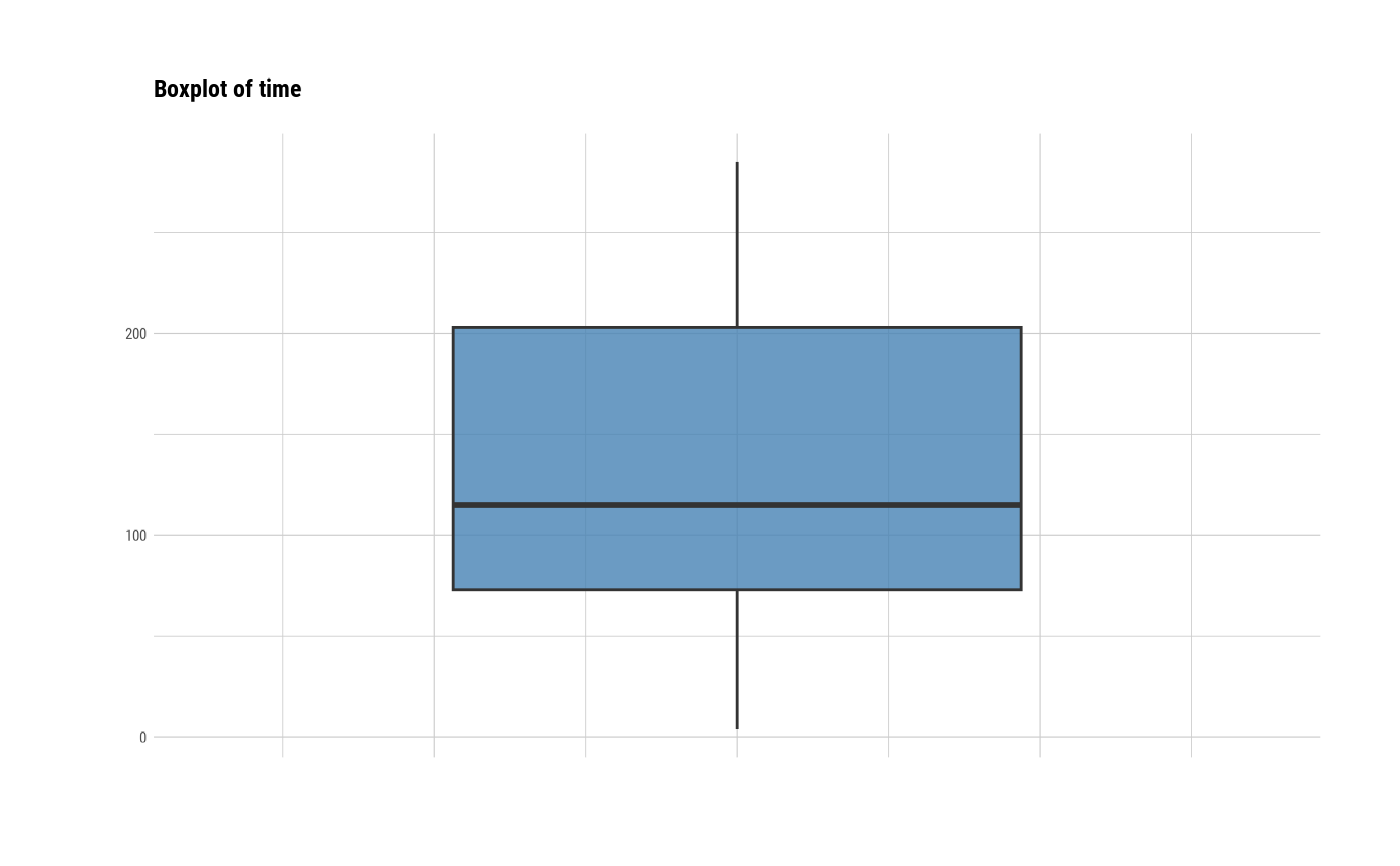
 # individual boxplot by variables
plot(all_var, indiv = TRUE, "boxplot")
# individual boxplot by variables
plot(all_var, indiv = TRUE, "boxplot")
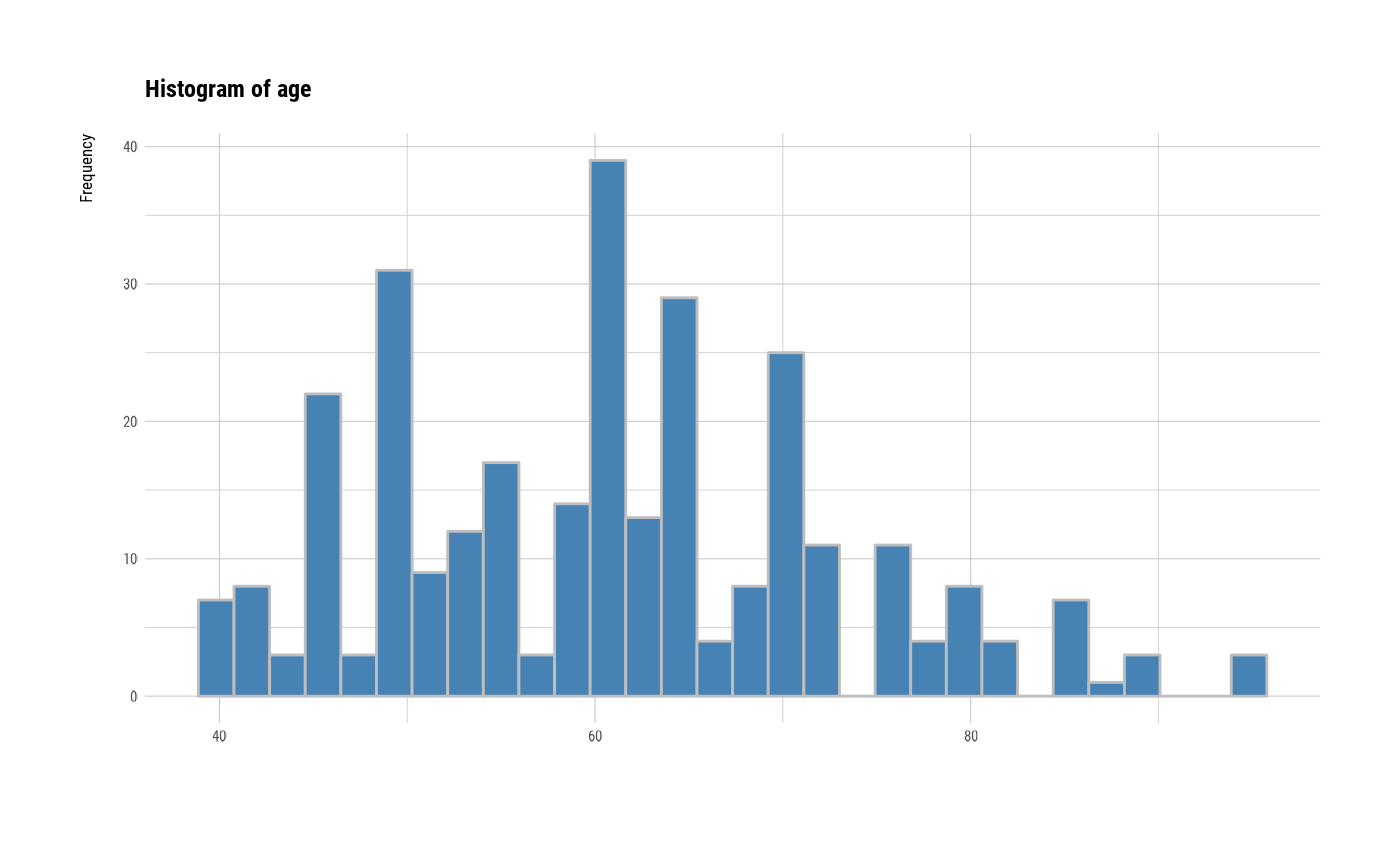
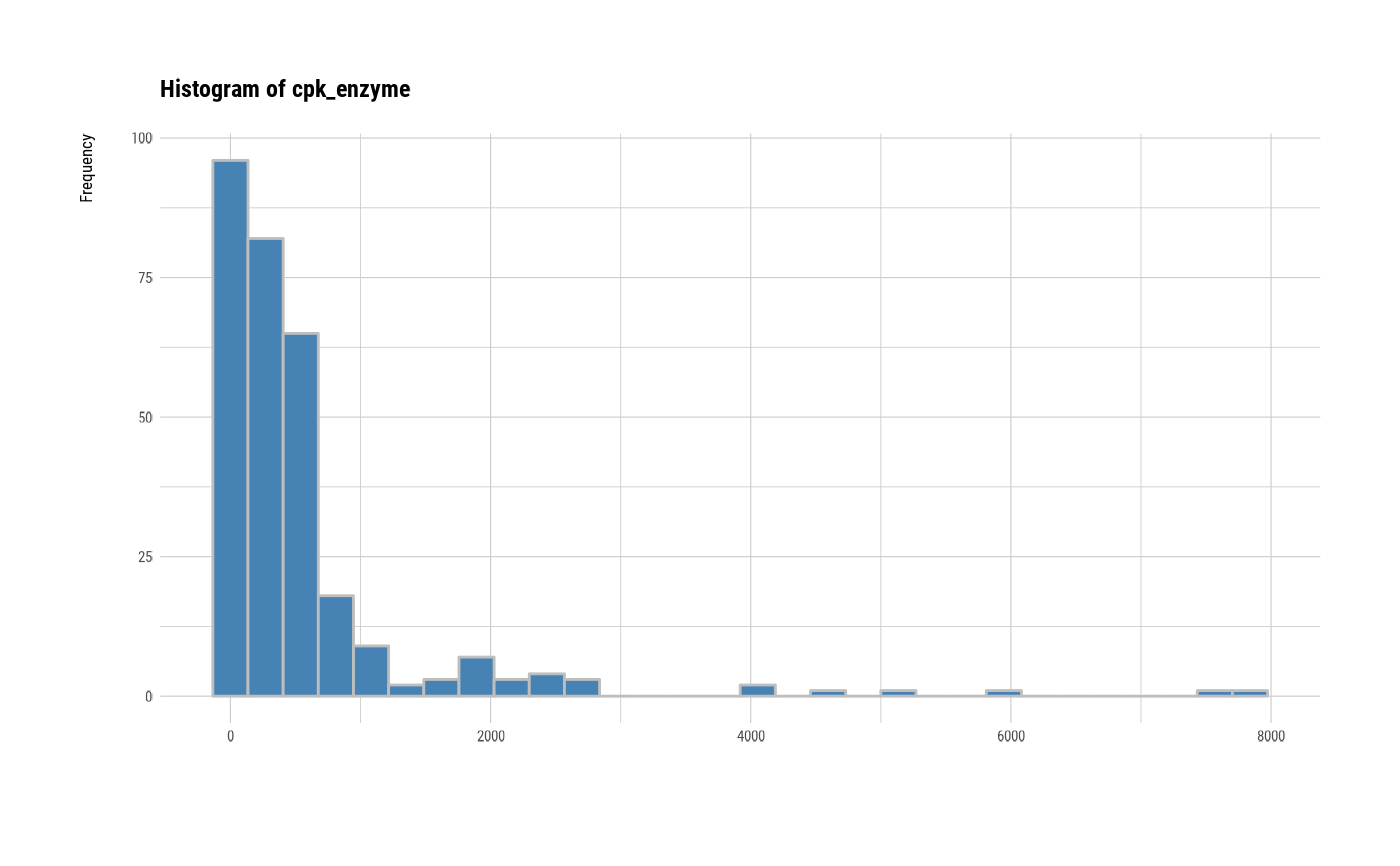
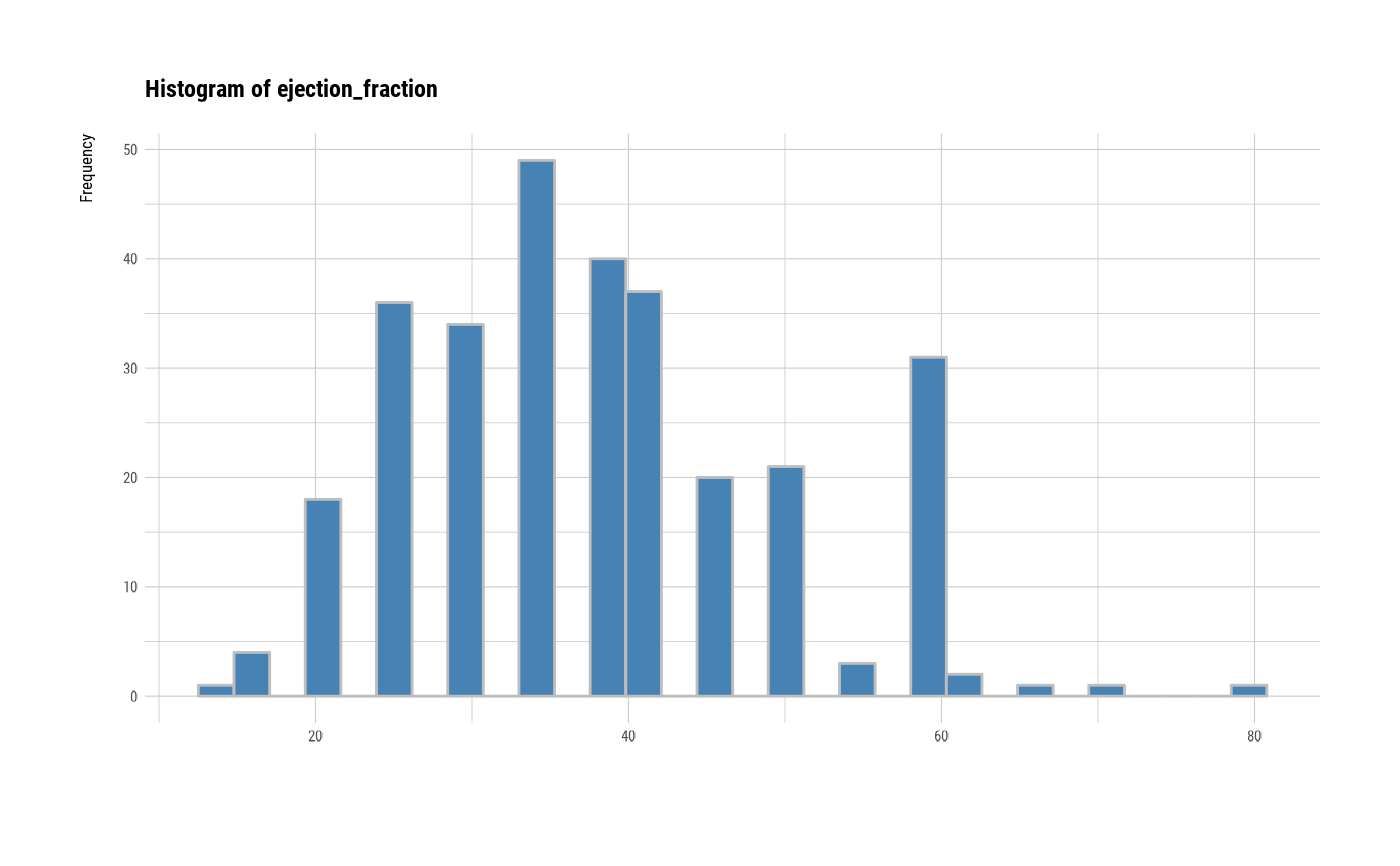
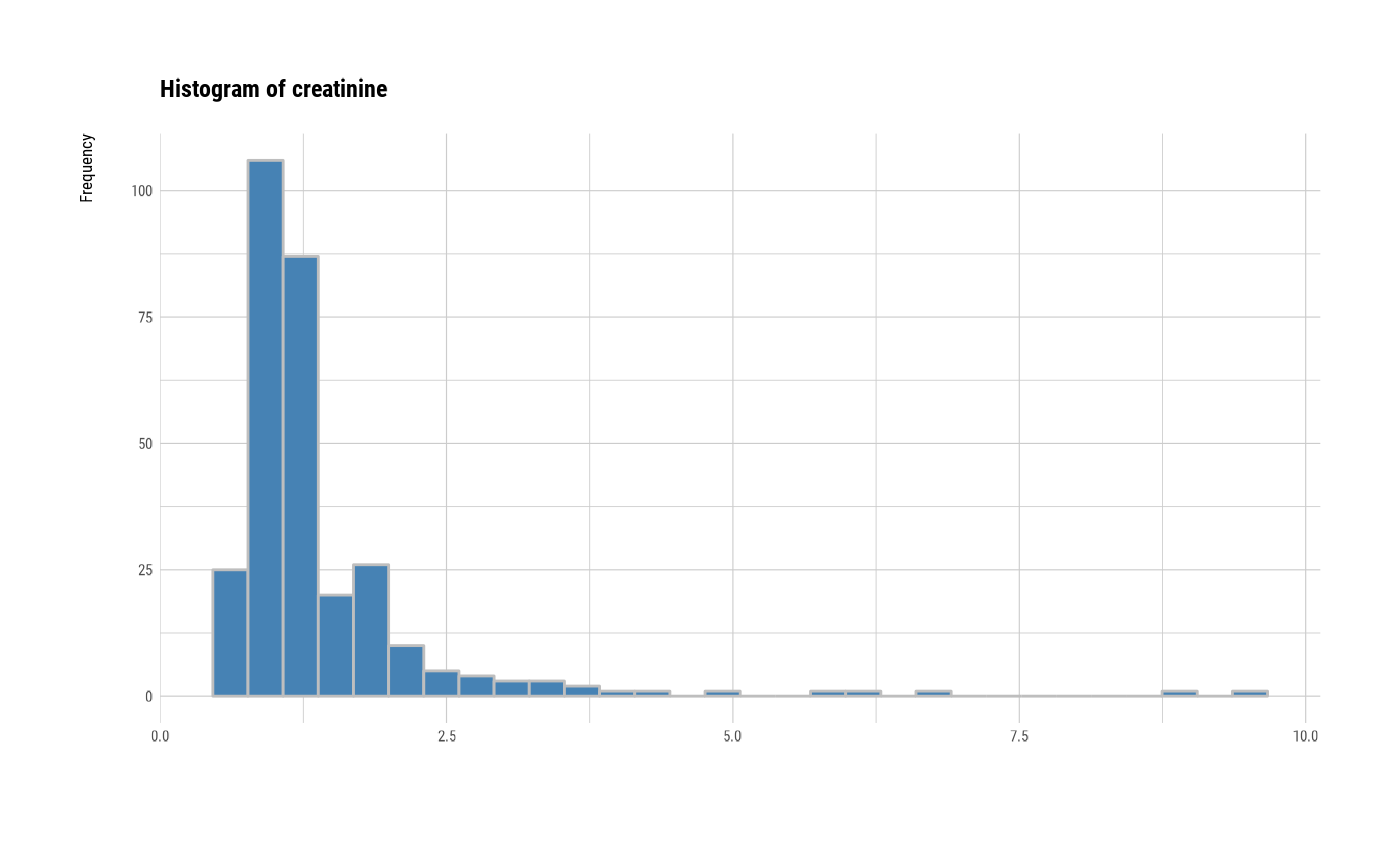
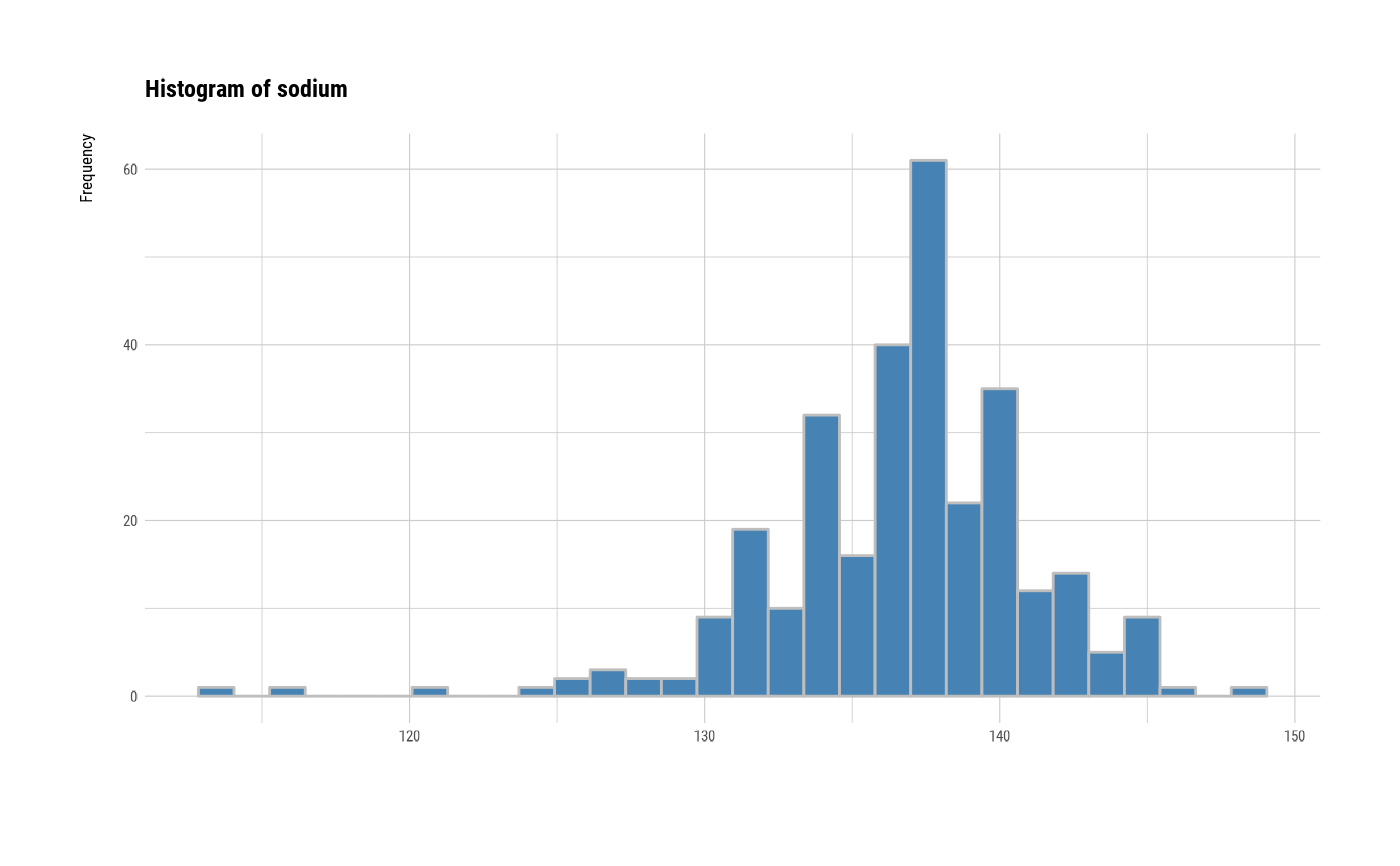
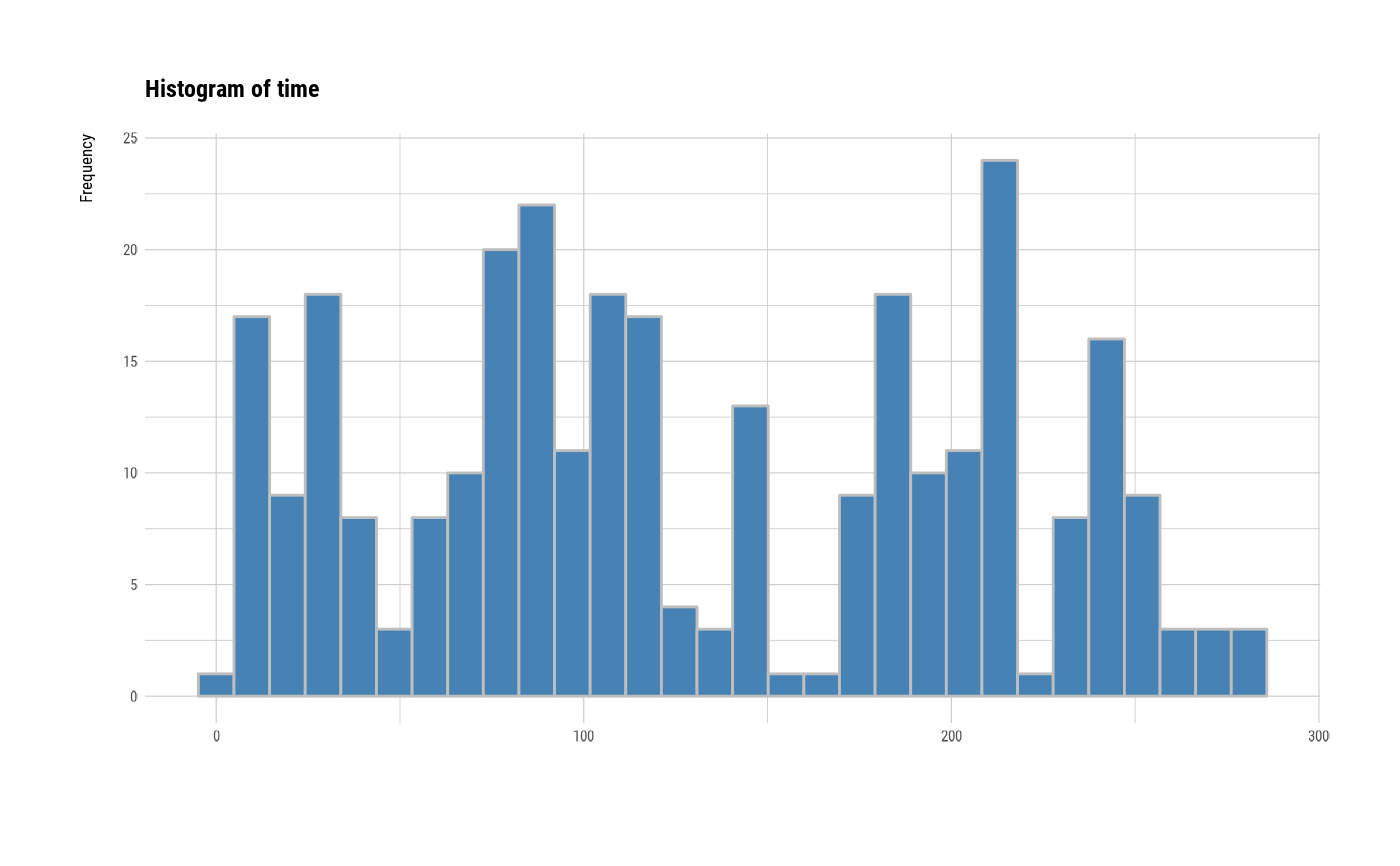
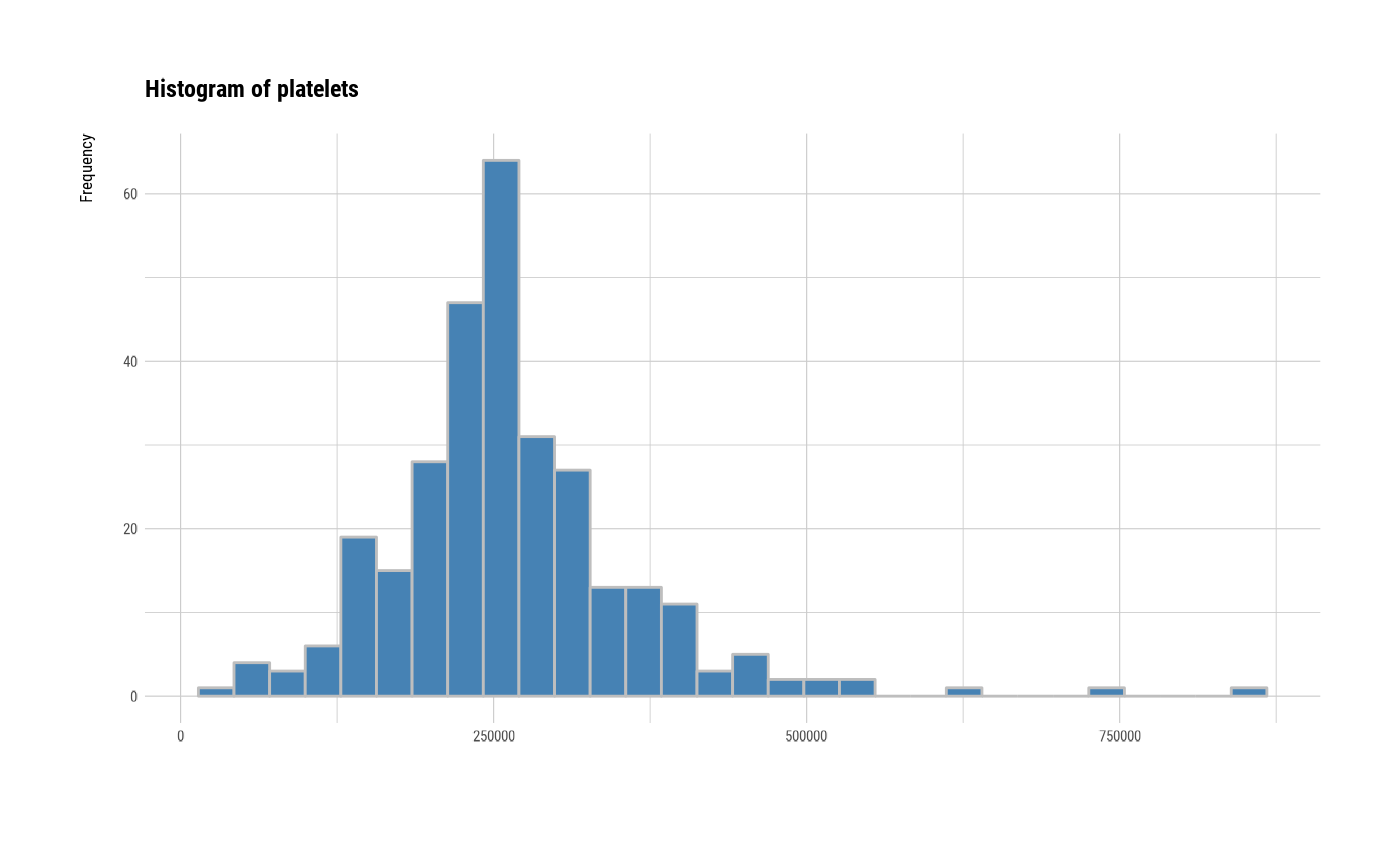
 # individual histogram by variables
plot(all_var, indiv = TRUE, "hist")
# individual histogram by variables
plot(all_var, indiv = TRUE, "hist")

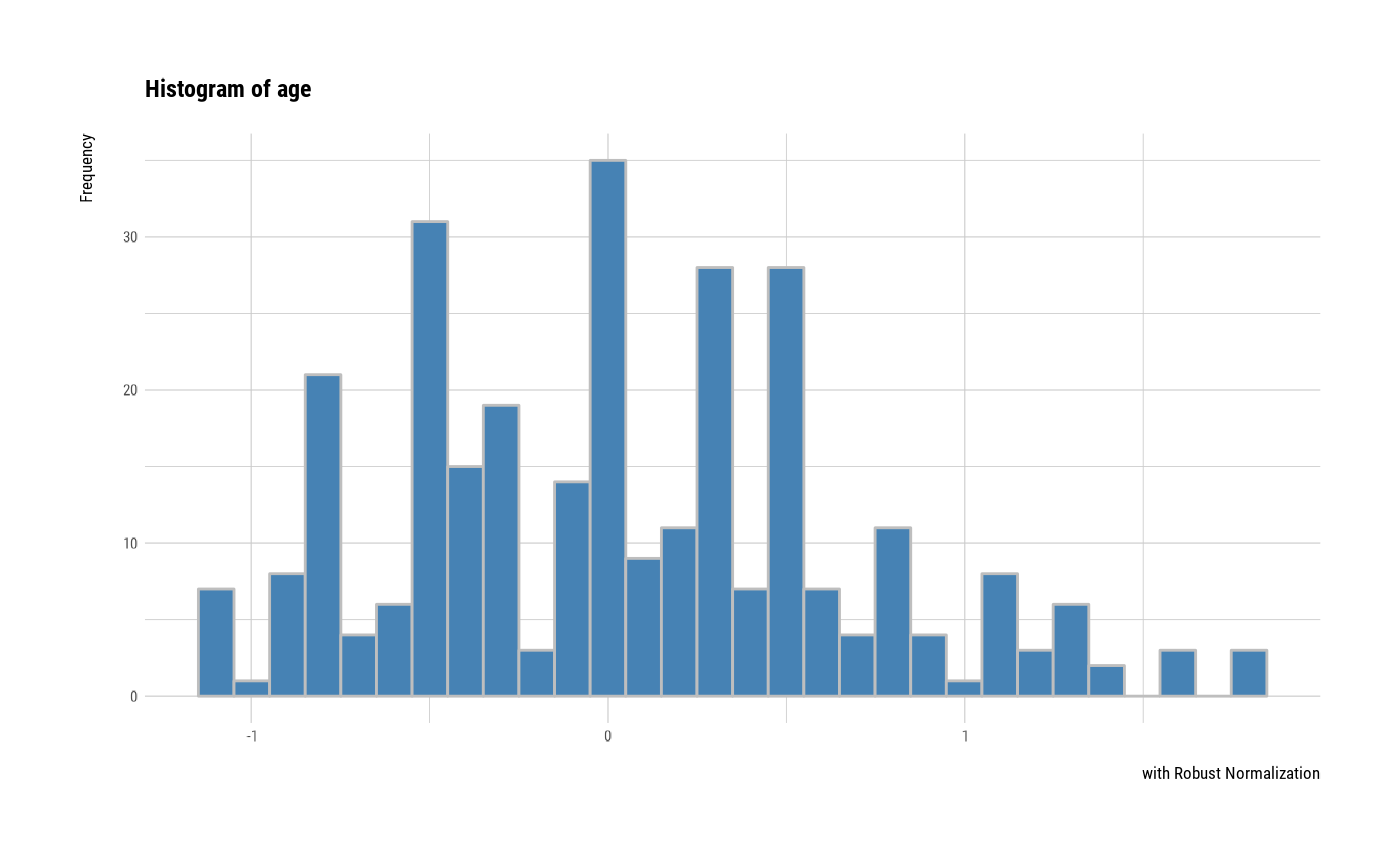
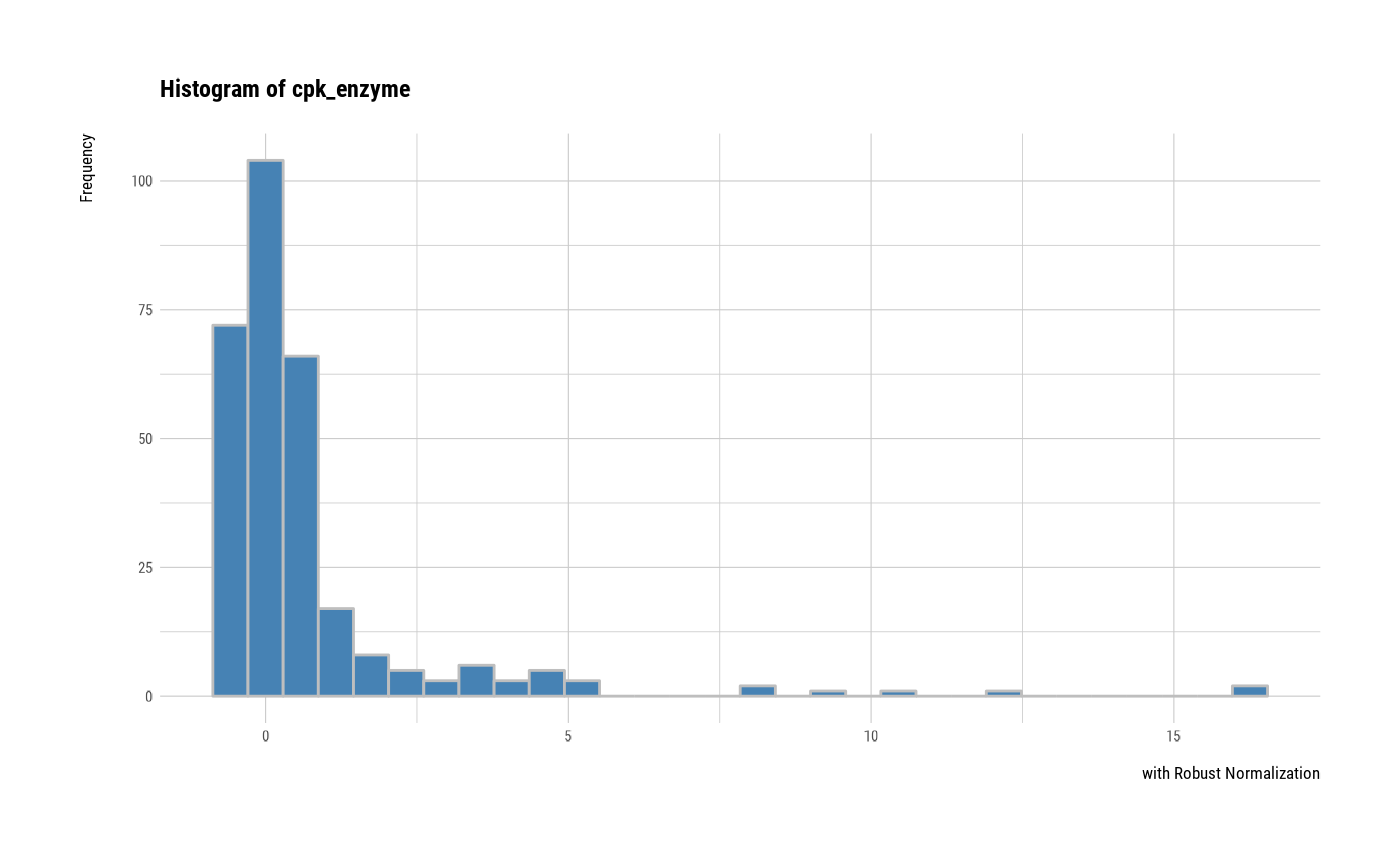
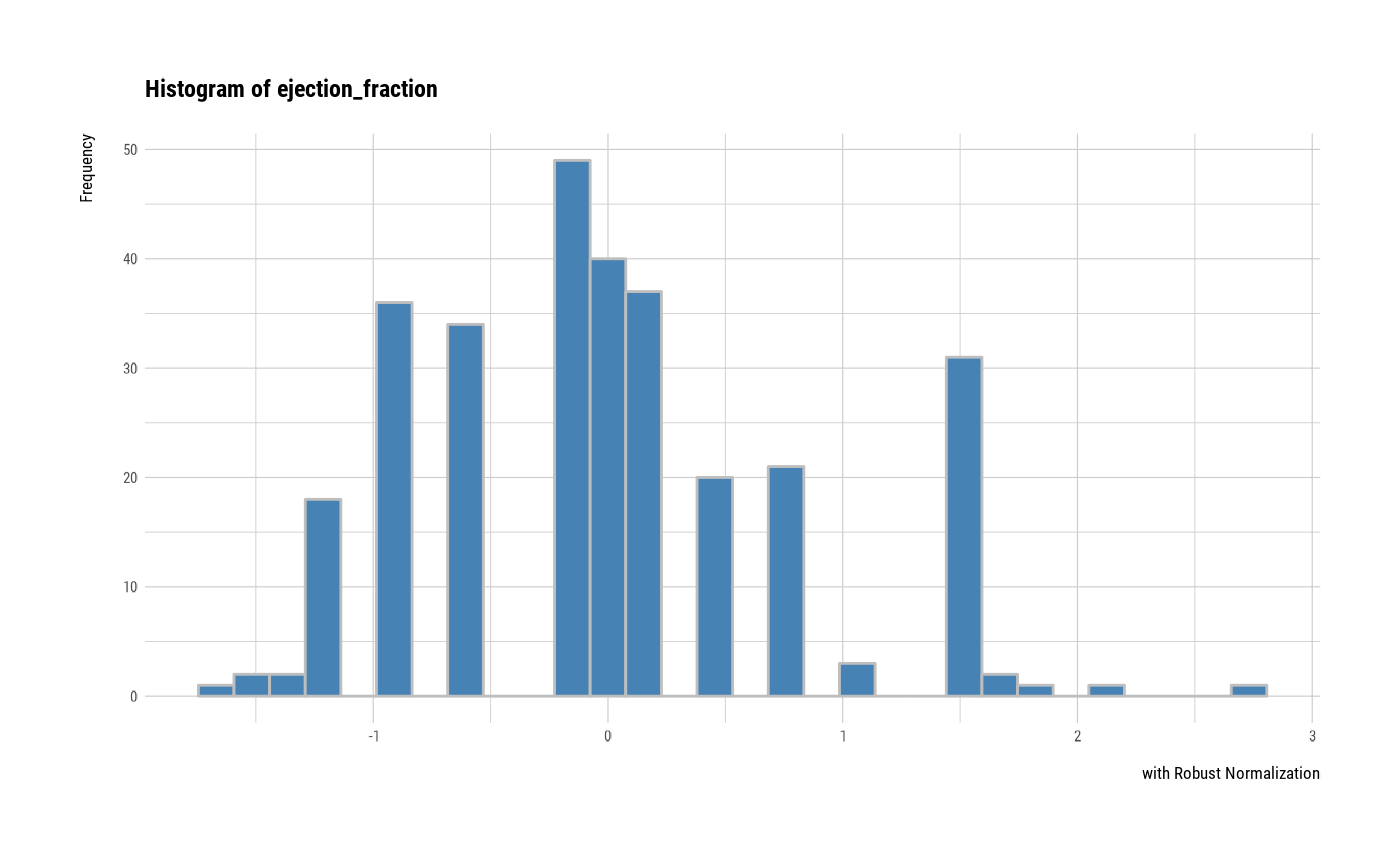
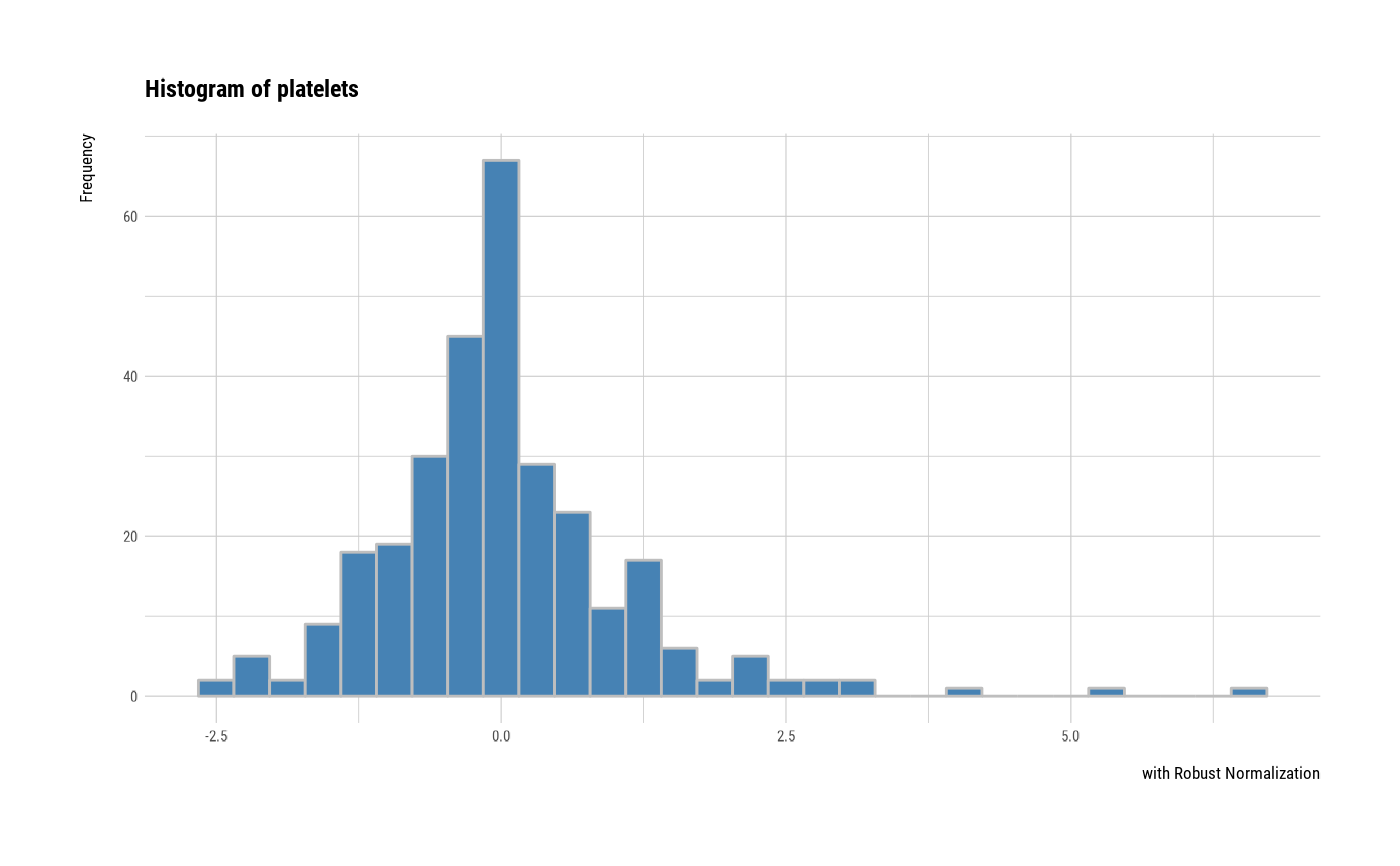
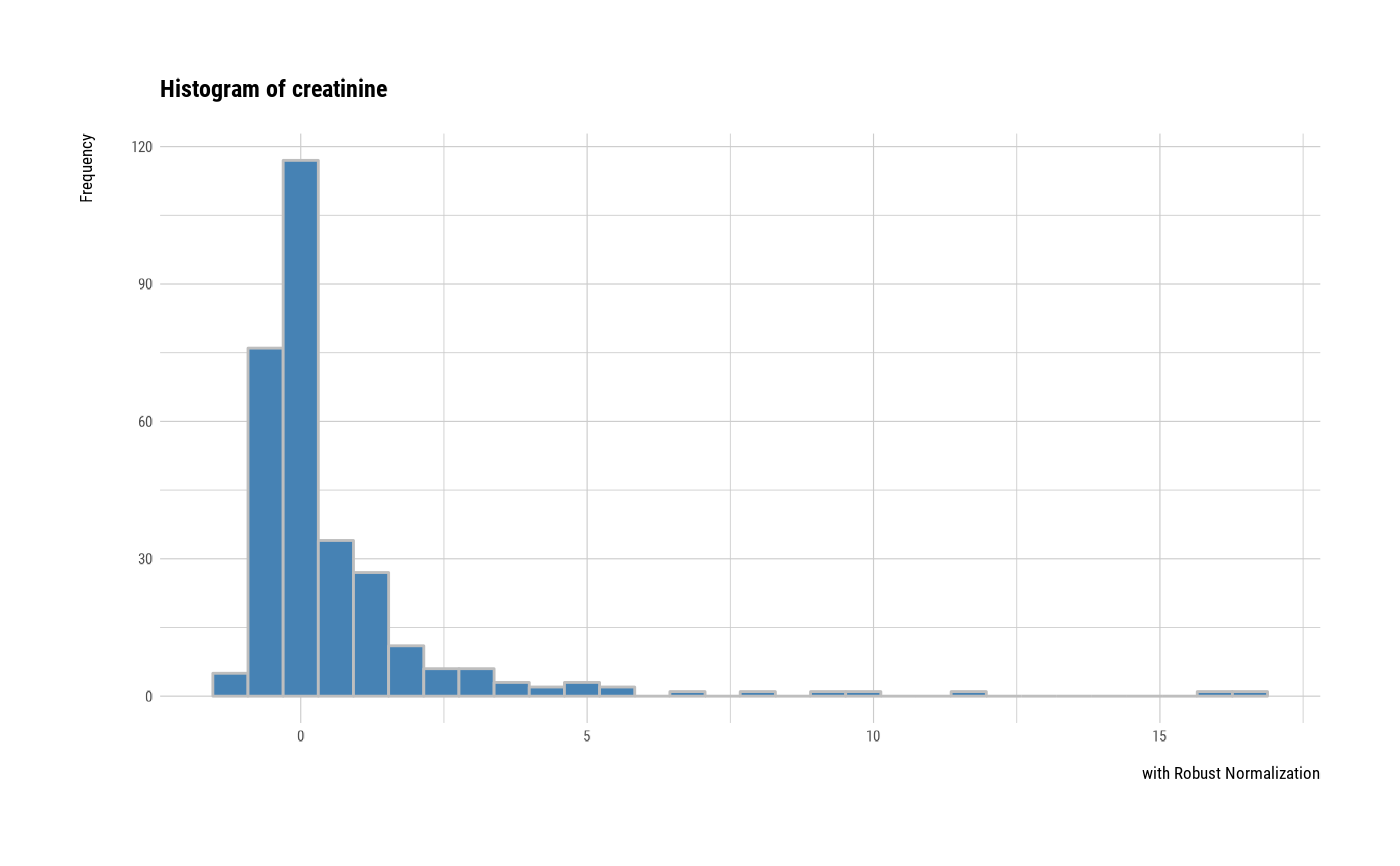
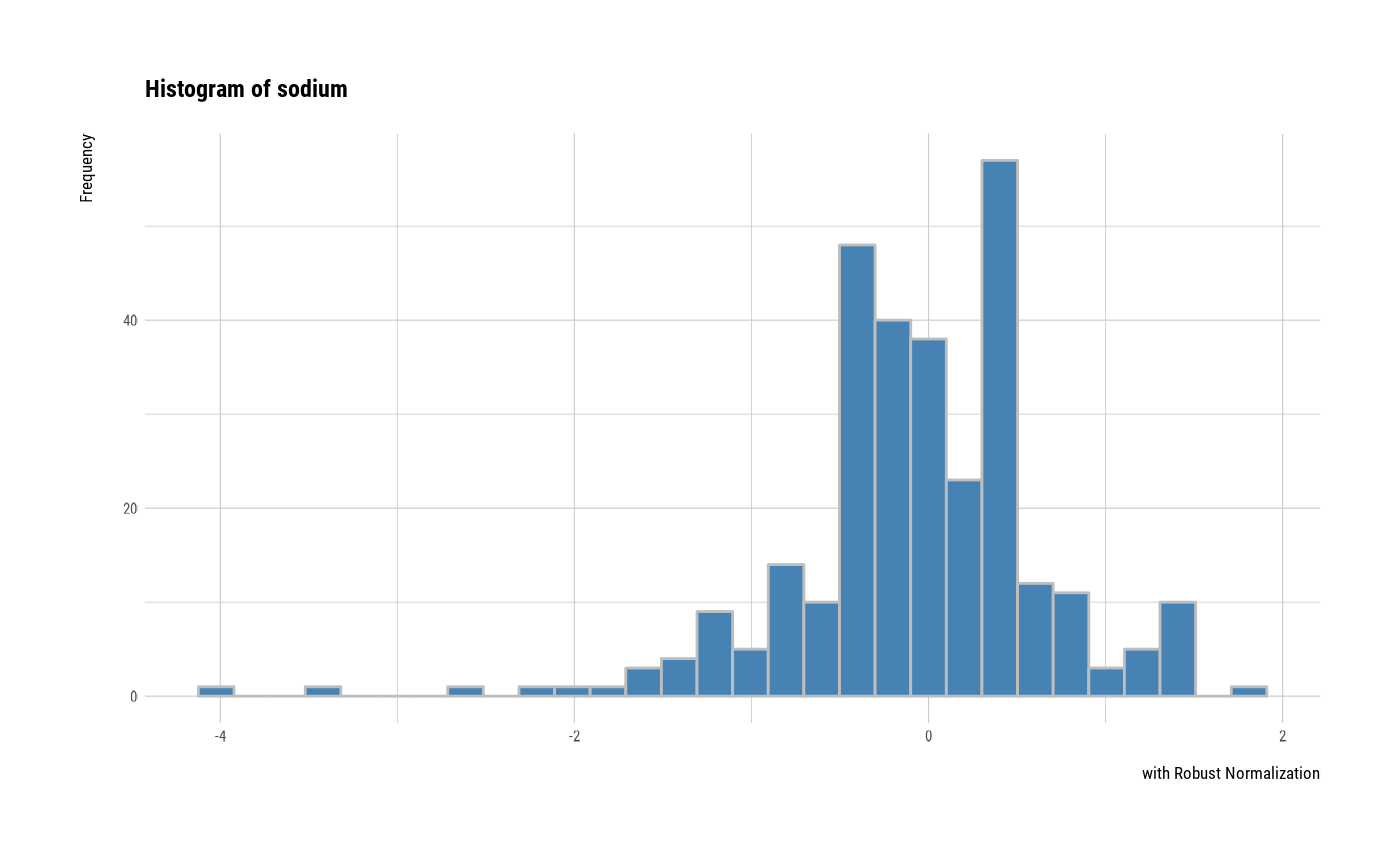
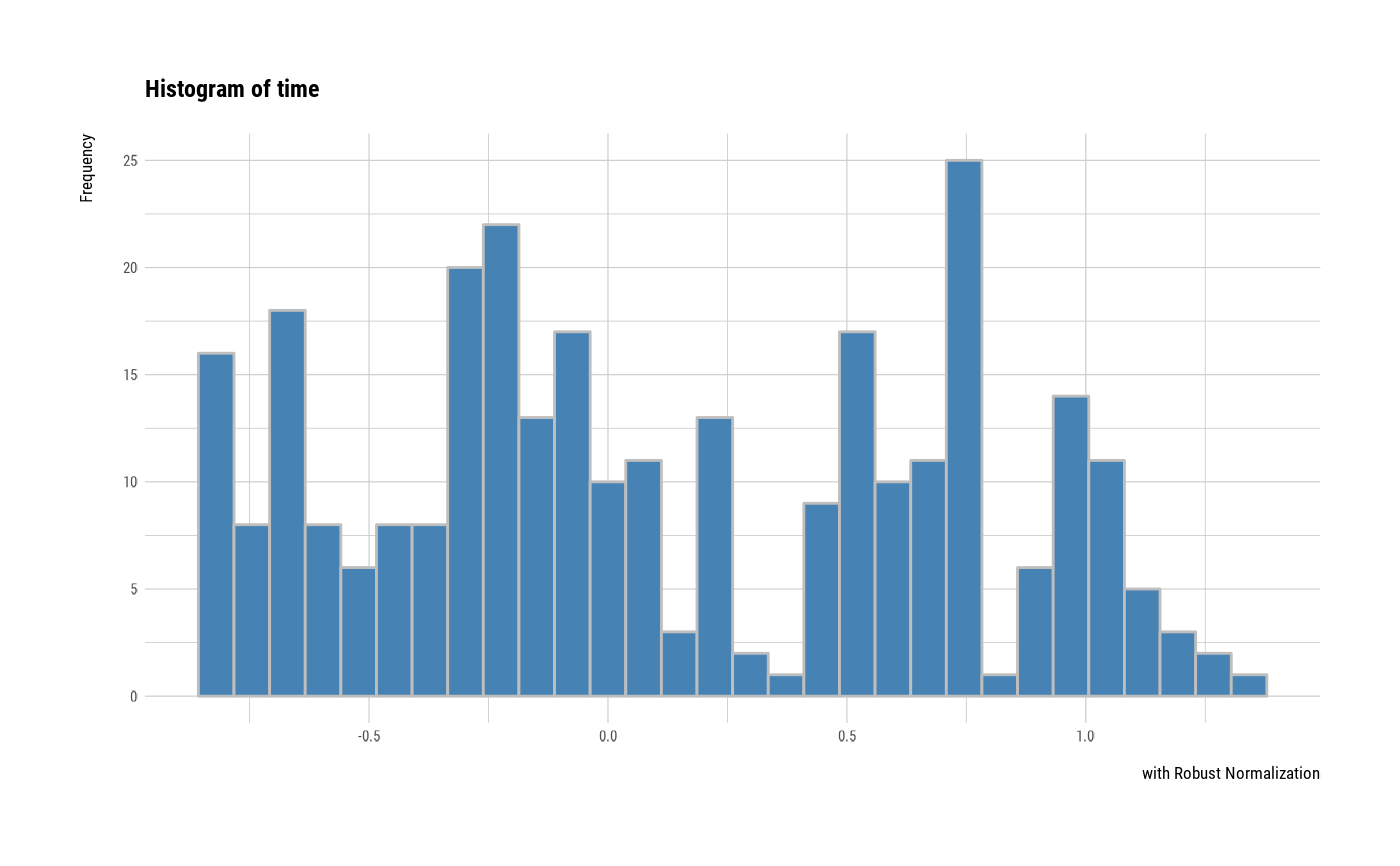
 # individual histogram by robust standardized variable
plot(all_var, indiv = TRUE, "hist", stand = "robust")
# individual histogram by robust standardized variable
plot(all_var, indiv = TRUE, "hist", stand = "robust")
 # plot all variables by prompt
plot(all_var, indiv = TRUE, "hist", prompt = TRUE)
# plot all variables by prompt
plot(all_var, indiv = TRUE, "hist", prompt = TRUE)


 # }
# }