들어가기
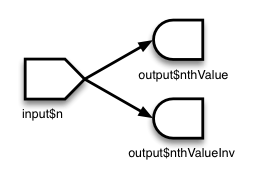
의도를 파악하자마자 바로 전달합니다. 반응출력이라 하지요.어렵지 않습니다. 유저 인터페이스를 통한 커뮤니케이션에서 화자인 의도에 대해서 그저 어떤 방식으로 반응(랜더링)할지 정하면 됩니다.
반응형 출력을 아시나요?
“반응형 출력(reactive output)은 사용자가 입력 위젯의 값을 변경하면, 이에 반응, 응답하여 출력을 자동으로 만들어주는 것을 의미합니다.”
일반적인 웹 어플리케이션은 사용자가 입력 위젯의 값을 변경한 후, “확인”, “실행” 등의 버튼을 누를 때 출력이 발생하지만, Shiny는 기본적으로 반응형 출력으로 결과를 반환합니다.
출력 위젯
출력 위젯의 이름의 접미사는 “Output”로 계산된 결과나 시각화 결과를 사용자에게 보여주는 기능을 수행합니다.
shiny 패키지의 출력 위젯은 같습니다.
[1] "dataTableOutput"          "htmlOutput"
[3] "imageOutput"              "plotOutput"
[5] "snapshotPreprocessOutput" "tableOutput"
[7] "textOutput"               "uiOutput"
[9] "verbatimTextOutput"
UI에 출력 위젯 추가하기
“selected_var”라는 아이디로 출력 위젯 textOutput을 UI에 추가합니다.
ui <- fluidPage(
  titlePanel("censusVis"),

  sidebarLayout(
    sidebarPanel(
      helpText("Create demographic maps with
               information from the 2010 US Census."),

      selectInput("var",
                  label = "Choose a variable to display",
                  choices = c("Percent White",
                              "Percent Black",
                              "Percent Hispanic",
                              "Percent Asian"),
                  selected = "Percent White"),

      sliderInput("range",
                  label = "Range of interest:",
                  min = 0, max = 100, value = c(0, 100))
    ),

    mainPanel(
      textOutput("selected_var")
    )
  )
)
렌더링 함수
렌더링 함수 이름의 접두사는 “render”로 입력 위젯의 값이 변경되면 반응하여 계산 결과를 출력 위젯에 랜더링합니다.
shiny 패키지의 렌더링 함수는 다음과 같습니다.
ls(pos = "package:shiny", pattern = "^render")
[1] "renderCachedPlot" "renderDataTable"  "renderImage"
[4] "renderPlot"       "renderPrint"      "renderTable"
[7] "renderText" "renderUI" | 렌더링 함수 | 생성 객체 | 내용 |
|---|---|---|
| renderDataTable | DataTable | 데이터 테이블 |
| renderImage | 이미지 | 이미지 파일 등 |
| renderPlot | 플롯 | 플롯 결과 |
| renderPrint | 텍스트 출력 | 모든 출력 |
| renderTable | 테이블 구조 객체 | data frame, matrix 등 |
| renderText | 텍스트 출력 | 텍스트 출력 |
| renderUI | 사용저 정의 UI | 기존 위젯으로 사용자가 정의한 위젯 |
렌더링 함수로 결과 반환하기
다음 예제는 렌더링 함수인 renderText로 아이디가 “selected_var”인 출력 위젯에 “You have selected this”라는 텍스트를 렌더링(출력)합니다.
그러나 이것은 반응 출력이 아닙니다.
server <- function(input, output) {
  output$selected_var <- renderText({
    "You have selected this"
  })
}
다음 예제는 렌더링 함수인 renderText로 아이디가 “selected_var”인 출력 위젯에 “You have selected this”라는 텍스트와 아이디가 “var”인 입력 위젯의 값을 붙여서 렌더링(출력)합니다.
이것은 반응 출력이 입니다. 렌더링 함수에 포함된 입력 위젯인 “var”의 값이 변경될 때마다 renderText 함수가 반응하여 계산된 결과를 출력 위젯인 “selected_var”에 렌더링합니다.
input$var는 아이디가 “var”인 입력 위젯을 의미하고, output$selected_var는 아이디가 “selected_var”인 출력 위젯을 의미합니다.
server <- function(input, output) {
  output$selected_var <- renderText({
    paste("You have selected", input$var)
  })
}
tutorial
반응 출력 완성하기 tutorial
다음 코드를 입력한 후, app.R이라는 이름의 파일로 저장하고 실행해 보세요. 완성된 반응 출력의 기능을 확인할 수 있습니다.
여러분은 server 파트를 완성하였습니다.
library(shiny)

ui <- fluidPage(
  titlePanel("censusVis"),

  sidebarLayout(
    sidebarPanel(
      helpText("Create demographic maps with
               information from the 2010 US Census."),

      selectInput("var",
                  label = "Choose a variable to display",
                  choices = c("Percent White",
                              "Percent Black",
                              "Percent Hispanic",
                              "Percent Asian"),
                  selected = "Percent White"),

      sliderInput("range",
                  label = "Range of interest:",
                  min = 0, max = 100, value = c(0, 100))
    ),

    mainPanel(
      textOutput("selected_var"),
      textOutput("min_max")
    )
  )
)

server <- function(input, output) {

  output$selected_var <- renderText({
    paste("You have selected", input$var)
  })

  output$min_max <- renderText({
    paste("You have chosen a range that goes from",
          input$range[1], "to", input$range[2])
  })

}

shinyApp(ui, server)
tutorial 페이지
Shiny 공식 tutorial 페이지를 살펴보고, 반응 출력을 이해하세요.
https://shiny.rstudio.com/tutorial/written-tutorial/lesson4/
추가 예제 실행해 보기
예제를 실행시켜 보고, 또다른 반응 출력을 경험해 보세요.
shiny::runExample("03_reactivity")